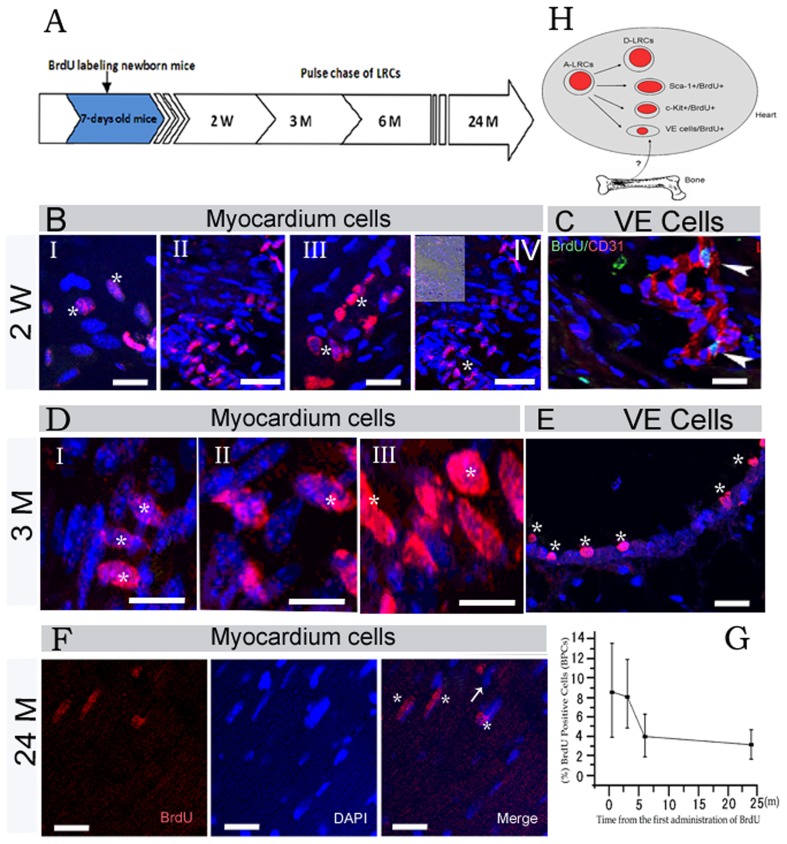
Figure 1. Existence and turnover of LRCs in cardiac tissues of normal adult mice.
(A) Shows schematic outlines of the BrdU pulse chase. w: week, m: month. (BI–IV) Show distinct locations of LRCs in the cardiac tissues after a 2 weeks chase, and the asterisk in I–IV indicates BrdU positive cells (asterisk), and the photo in the top left corner of IV contains white light. (C) Shows immunohistostaining results of BrdU (green) and CD31 (red) for cardiac tissues, and arrowhead indicates the location of LRCs after a 2 weeks chase. (D) Shows LRCs are mainly myocardium cells after a 3 months chase, and the asterisk in I–III shows BrdU (red) positive cells. (E) Shows LRCs located in the vicinity of vascular endothelial region with varied embedding after 3 months chase, and 6 asterisks indicate BrdU positive cells. (F) Shows identified LRCs in cardiac tissues after 24 months chase, and asterisk indicates BrdU positive myocardium cells, however, an arrow indicates ‘BrdU light’ myocardium cells. (G) Shows statistical analysis of BrdU label-retaining cells. The black boxes represent the mean values of LRCs (n = 2 mice at each time point). The error bars represent standard derivations. P = 0.026<0.05 shows there was significant difference (2 weeks versus 6 months), however, P = 0.103>0.05 indicates there was no significant difference (6 months versus 24 months). (H) Shows a model of LRCs in heart after birth, a part of activated-LRCs turn into d-LRCs. Scale bars: BI, BIII, C, E and F = 20 μm; DI–DIII = 30 μm; BII, BIV = 40 μm.

