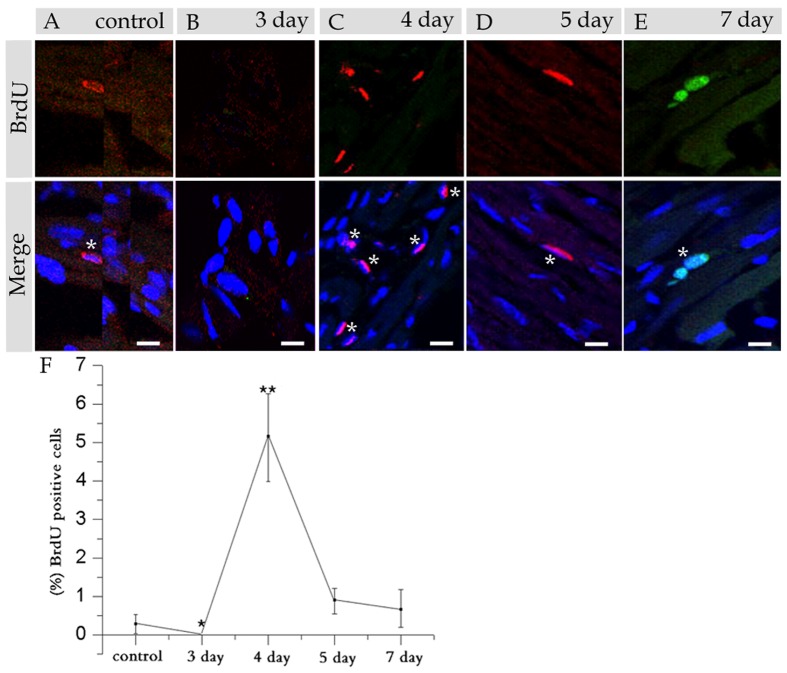
Figure 2. Immunohistostaining with BrdU and DAPI of the control and the mice at various days post 5-Fu exposure.
(A) Shows staining of a control heart section. (B) Shows staining on day 3. (C) Shows staining on day 4. (D) Shows staining on day 5. (E) Shows staining on day 7. (F) Shows the statistical analysis of BrdU positive cells at each time point (n = 3 mice). Nuclei were stained with DAPI (blue), and the asterisks indicate ‘BrdU bright’ cells. *P<0.01 (control versus day 3 post-injury) and **P<0.01 (control versus day 4 post-injury) indicates most significant differences (scale bar = 20 μm).

