
Figure 3. Chasing and kinetics of activated CSCs/CPCs every 12 h on day 4 post-injury.
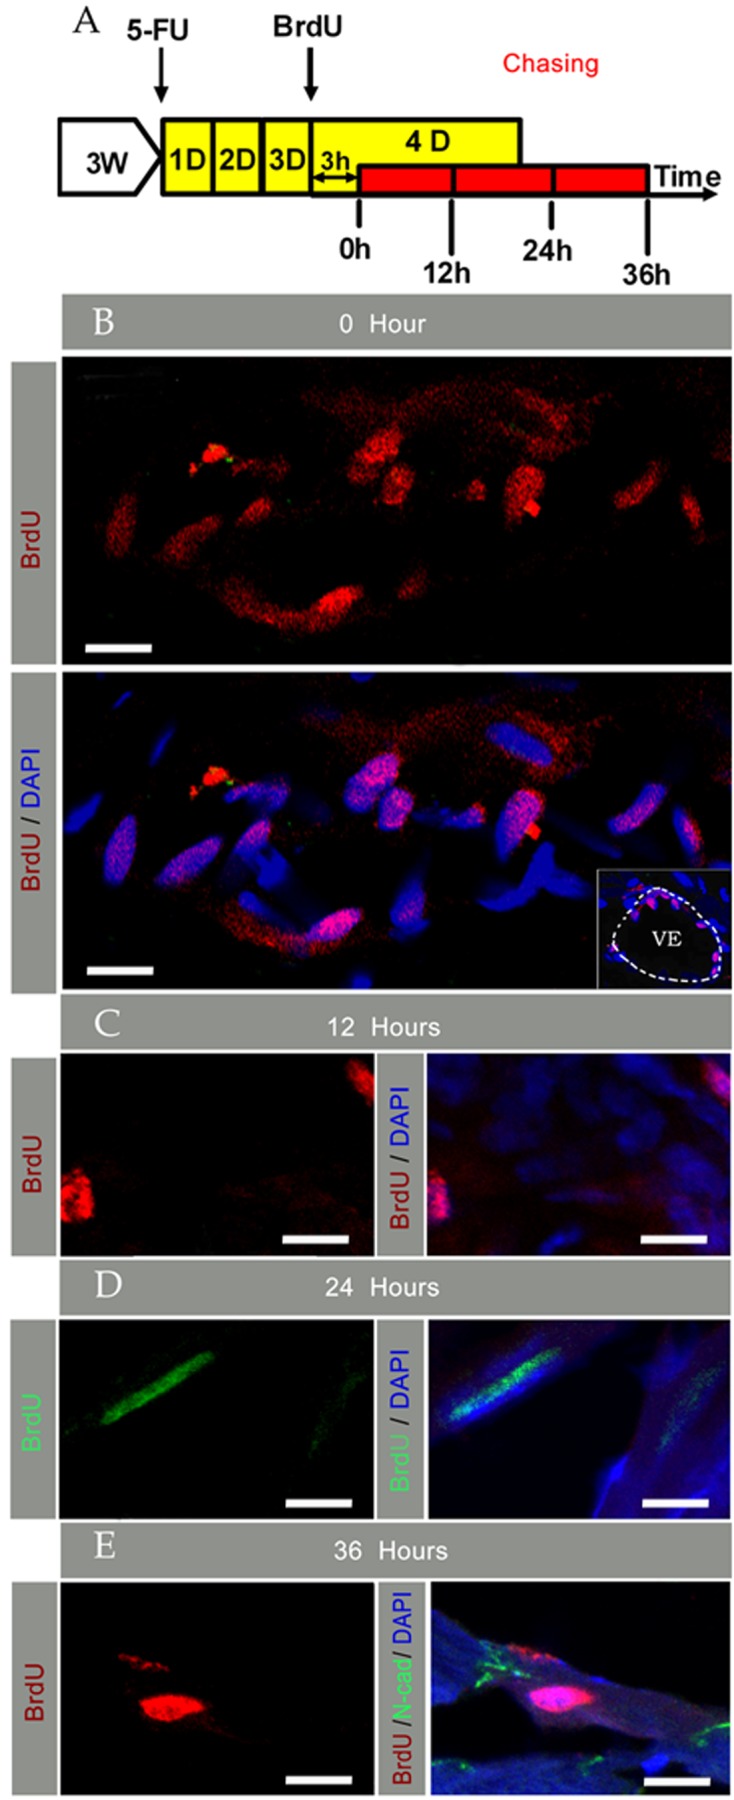
(A) Shows schematic outlines of 5-Fu-induced injury plus BrdU pulse-chase assays. (B) Shows staining at the initiation of pulse chase, and the right corner photo in (B) shows vascular endothelial location of ‘BrdU bright’ cells; the dotted line indicates the VE region. (C) Shows staining after a 12 h chase. (D) Shows staining after a 24 h chase. (E) Shows staining after a 36 h chase. Nuclei were stained with DAPI (scale bar = 10 μm).