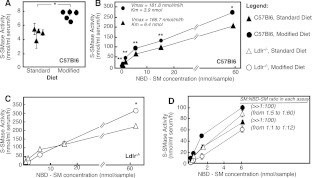
Figure 1. S-SMase activity in serum.
Mice of the indicated genotypes were placed on either a standard or modified diet for 10 weeks. S-SMase activity was measured using C6-NBD-SM as a substrate. (A) S-SMase activity in C57Bl6 mice measured by using 0.4 nmol of NBD-SM per sample. Results are shown as means±S.D. (n=3) for each mouse. (B–D) Michaelis–Menten kinetics of the S-SMase activity in C57Bl6 and ldlr−/− mice on either standard or modified diet. The assays are carried out using serum (4–6 animals per assay) and the indicated substrate concentrations. Mean values of triplicates ±S.D. are shown. *P<0.05 and **P<0.01 according to a Student's t test. SM/NBD-SM ratio in (D) was calculated by dividing the measured endogenous LDL-SM concentration (presented in Table 1) and the amount of NBD-SM in each assay.

