Figure.
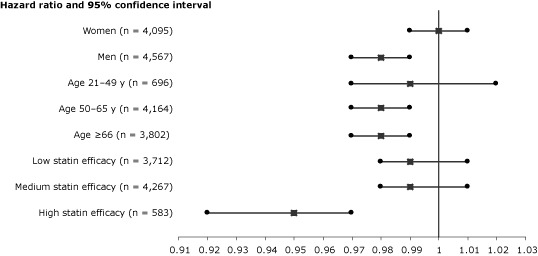
Proportional effects of persistence with statin therapy on reduction of risk for overall cancer per 10% of follow-up days covered with statins. Squares indicate adjusted hazard ratios for all covariates listed in Table 2. Horizontal lines indicate 95% confidence intervals. The 3 statin efficacy levels were created on the basis of expected amounts of low-density lipoprotein reduction from baseline.
| Cases of Cancer | Hazard Ratio (95% Confidence Interval) |
|---|---|
| Women (n = 4,095) | 1 (0.99–1.01) |
| Men (n = 4,567) | 0.98 (0.97–0.99) |
| Age 21–49 y (n = 696) | 0.99 (0.97–1.02 |
| Age 50–65 y (n = 4,164) | 0.98 (0.97–0.99) |
| Age ≥66 (n = 3,802) | 0.98 (0.97–0.99) |
| Low statin efficacy (n = 3,712) | 0.99 (0.98–1.01) |
| Medium statin efficacy (n = 4,267) | 0.99 (0.98–1.01) |
| High statin efficacy (n = 583) | 0.95 (0.92–0.97) |

