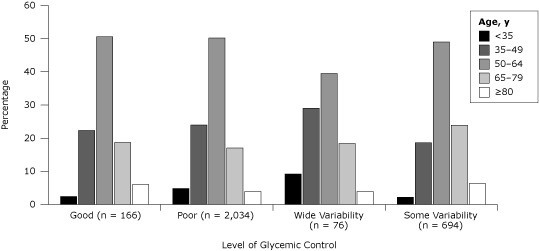
Figure 1.
Glycemic control related to age in patients with diabetes, unadjusted, Hawaii, 2006–2009. Good control indicated by an HbA1c of less than 7% for 3 years, and poor control indicated by an HbA1c higher than 9% for 3 years. Wide glycemic variability refers to patients who had a reduction in annual mean HbA1c from higher than 9% to less than 7%, followed by an increase to higher than 9%. Some variability refers to patients who did not meet criteria for the other 3 categories. Glycemic control differed significantly by age (P < .001, Pearson χ2 tests)
| Age, y | Level of Glycemic Control |
P Value | |||
|---|---|---|---|---|---|
| Good (n = 166), % | Poor (n = 2,034), % | Wide Variability (n = 76), % | Some Variability (n = 694), % | ||
| <35 | 2.4 | 4.8 | 9.2 | 2.2 | <.001 |
| 35–49 | 22.3 | 24.0 | 29.0 | 18.6 | |
| 50–64 | 50.6 | 50.2 | 39.5 | 49.0 | |
| 65–79 | 18.7 | 17.0 | 18.4 | 23.9 | |
| ≥80 | 6.0 | 3.9 | 3.9 | 6.3 | |