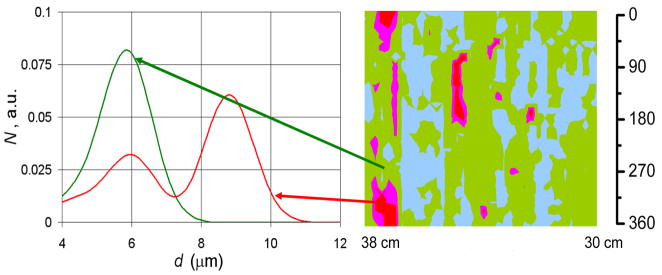
Fig. 3.
Nuclear size distributions for one high grade dysplasia site and one non-dysplastic site in BE of one of the patients. Dark (red and pink online) regions of the map indicate areas suspicious for dysplasia based on nuclear size distributions extracted from the backscattering spectra for each individual spatial location. Non-dysplastic BE sites had nuclear size distributions centered about 5–6 μm diameter while sites marked as suspicious for dysplasia have nuclear size distributions with a main peak centered from 9 to 15 μm. The arrows indicate the specific locations on the esophageal surface from which the size distributions extracted from the polarized LSS data.

