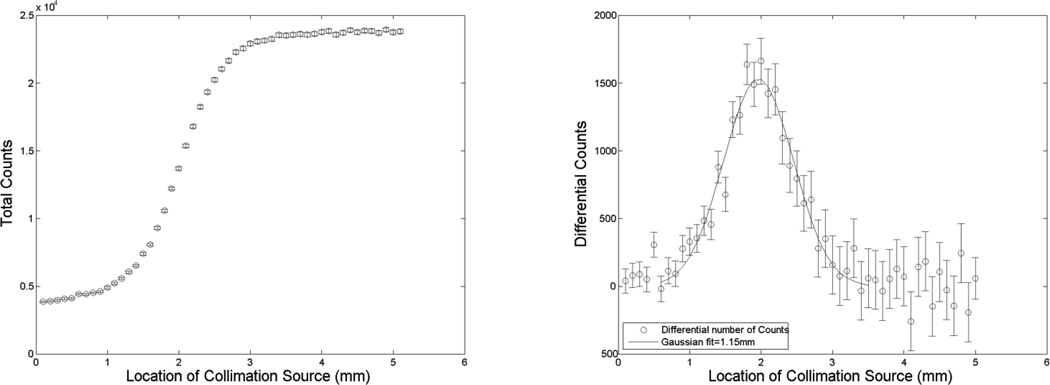
Fig. 5.
Left: Total number of counts at each source location collected for 15 minutes at each point, with 0.1 mm step size. Right: Geometric beam spread for DOI measurements, which shows the count differences between neighboring points with 0.1 mm apart in the plot. The solid line is a Gaussian fit to these data, and has a FWHM of 1.2 mm.

