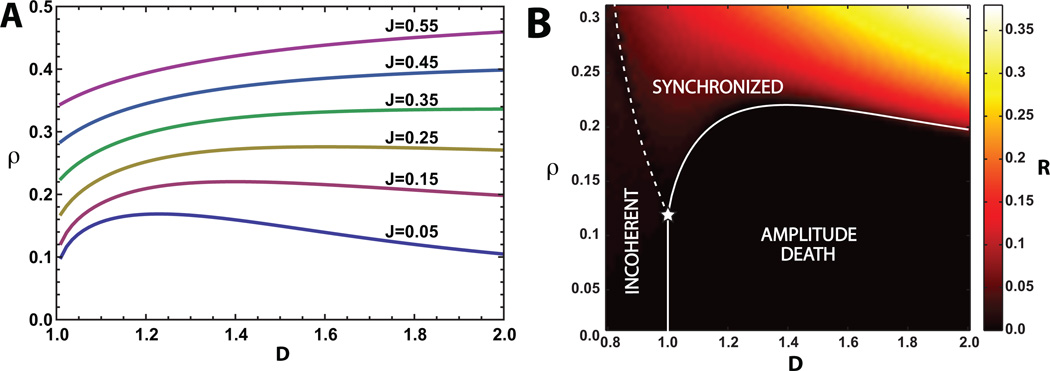
Figure 3.
(A) Phase boundaries in ρ vs D plane for heterogeneous oscillators drawn from a rectangular distribution (Γ = 0.5) for J = .05–0.55 (bottom to top). The synchronized phase occurs above the phase boundary and the amplitude death phase occurs below the boundary. Parameters are as in Fig.2 with ω0 = 1, and λ0 = 1. Comparing with the corresponding phase boundaries in Fig. 2 for homogenous oscillators, we see that oscillator heterogeneity increases the density, ρ, at which the transition from amplitude death to synchrony occurs for a fixed D. (B) Numerical simulations for J = 0.15. Heat map of the amplitude of collective oscillation, R = |Z|, from simulations of N = 100 oscillators drawn from a rectangular frequency distribution with parameters as in (A). The dotted line indicates the Kuramoto-like transition from an incoherent phase with D < 1 to synchronized oscillations and the solid line indicates the transition from the amplitude death phase to the synchronized phase. The star marks the point along the line D = λ0 = 1 at which all three phases meet. This is similar to the experimental results for catalytic BZ particles [5]

