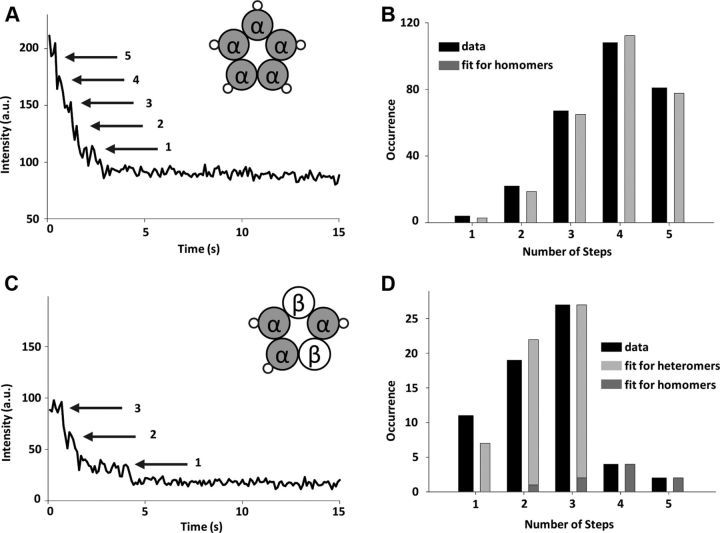
Figure 2.
α-subunit stoichiometry of GlyR. A, Representative intensity–time trace showing photobleaching steps observed in a homomeric GlyR channel. Five steps are clearly visible (arrows). B, Histogram of the number of photobleaching steps counted from intensity–time traces (black bars) after correction for missed events and the best fit to the binomial distribution for five subunits (gray bars) (goodness of fit, p = 0.82). C, Representative intensity–time trace showing three photobleaching steps observed in heteromeric channels where α1-subunit is labeled. Inset, Proposed composition of the heteromer. D, Histogram of the number of photobleaching steps counted from intensity–time traces after correction for missed events (black bars) in a mixed population of homomeric and heteromeric channels and the binomial distribution for three subunits (light gray bars) and five subunits (dark gray bars). The gray bars are calculated from the best fit to the data, in which the proportion of homomeric and heteromeric channels and the probability for the VFP to be fluorescent were left as free parameters (goodness of fit, p = 0.52). The corresponding observed and calculated percentage of traces that show one to five photobleaching steps are given in Table 2.

