
Figure 5.
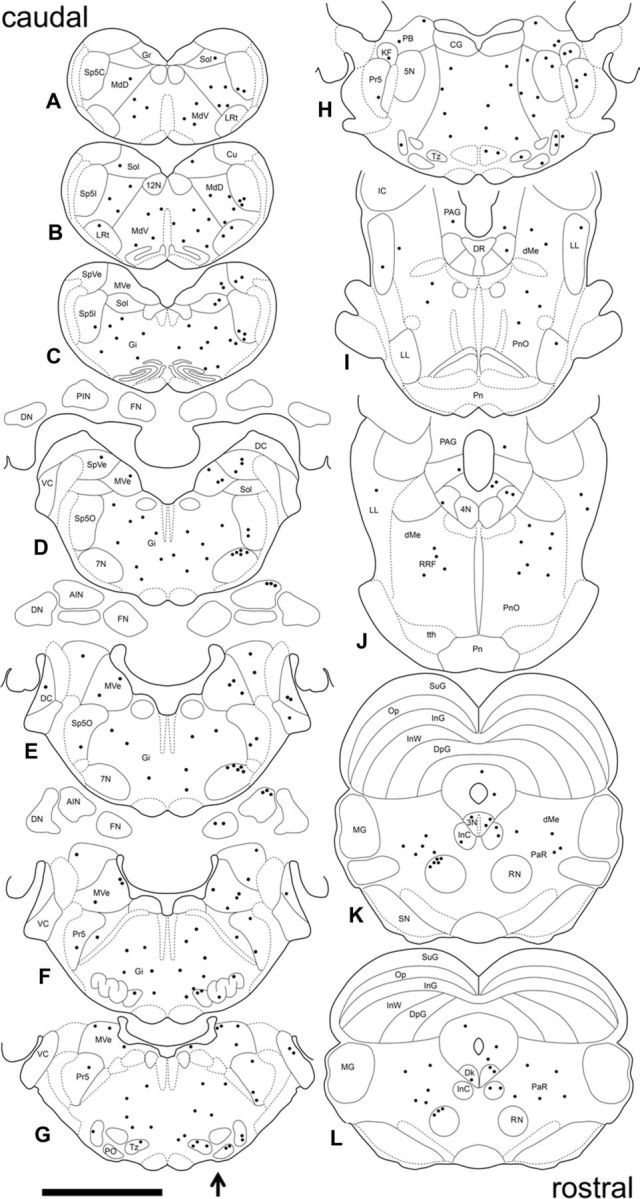
Distribution of PRV-labeled neurons in the brain 4.5 d after PRV injection in the right OOM. A composite of the location of PRV-labeled neurons found across four animals plotted in sequential sections to best represent the pattern of PRV labeling. Sections are arranged caudorostrally (A–L). The arrow indicates the side of PRV injection. Each dot represents one PRV-labeled neuron. See Figure 3 for abbreviations. Scale bar, 5 mm.