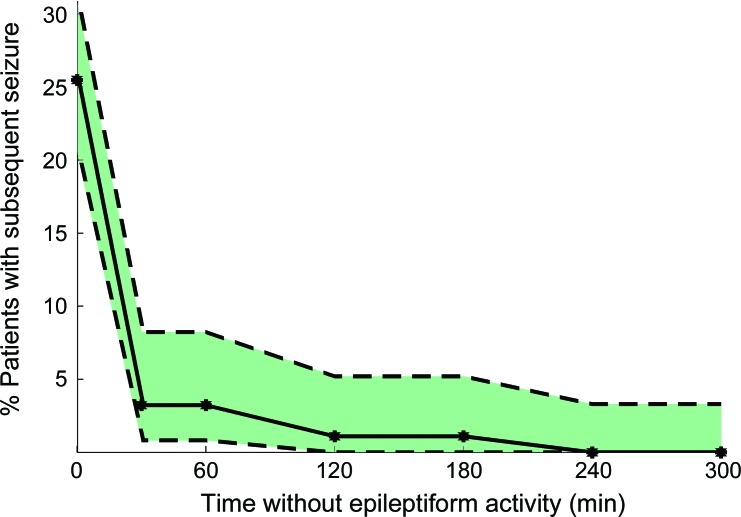
Figure 1. Seizure rate as a function of time without epileptiform activity.
The maximum, minimum, and observed seizure rate on subsequent continuous EEG monitoring as a function of time already passed without epileptiform activity (in the cohort of patients without epileptiform activity to that time). The observed seizure rate is indicated with the solid line. The upper dashed line indicates the maximum possible true seizure rate in the underlying population that could have resulted in the observed seizure rate (with a probability p > 0.05); the lower dashed line indicates the minimum possible true seizure rate that could have resulted in the observed seizure rate (with a probability p > 0.05).

