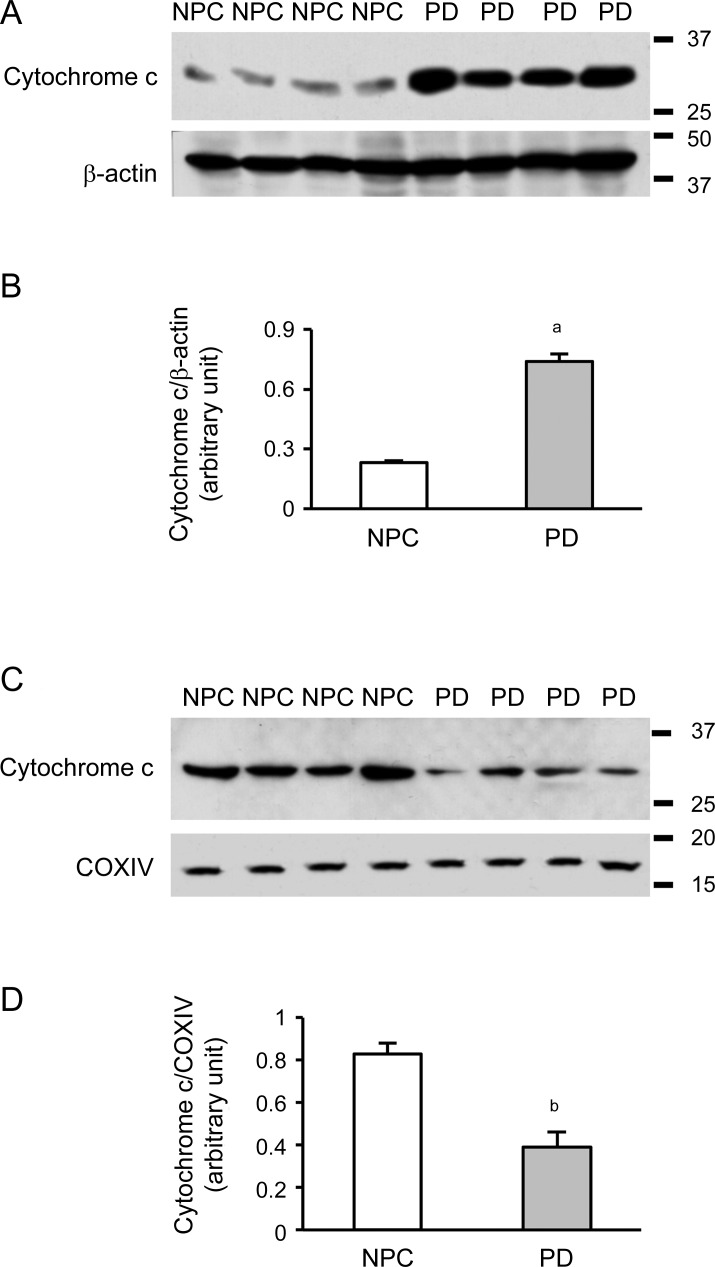
Figure 3. Cytochrome c is released from mitochondria in Parkinson disease (PD) brains.
(A) Western blot showed cytochrome c release in cytoplasmic fractions of samples from the temporal cortex. (B) Spot density analysis showed increased levels of cytoplasmic cytochrome c release in PD brain samples (ap < 0.01). (C) Cytochrome c was detected in the mitochondrial fraction from temporal cortex using Cox IV as the mitochondrial loading control. (D) Spot density analysis showed decreased levels of cytochrome c in the mitochondria from PD brain samples (bp < 0.01). NPC = nonpathologic control.

