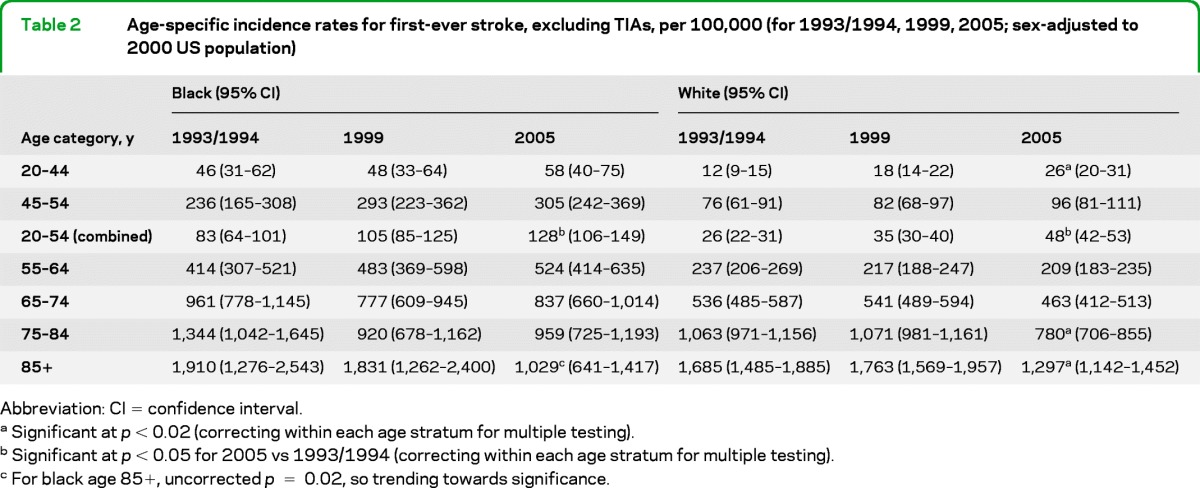
Table 2.
Age-specific incidence rates for first-ever stroke, excluding TIAs, per 100,000 (for 1993/1994, 1999, 2005; sex-adjusted to 2000 US population)

Abbreviation: CI = confidence interval.
Significant at p < 0.02 (correcting within each age stratum for multiple testing).
Significant at p < 0.05 for 2005 vs 1993/1994 (correcting within each age stratum for multiple testing).
For black age 85+, uncorrected p = 0.02, so trending towards significance.
