
Table 4.
Risk factor prevalence in Cincinnati population-based surveys, comparable Cincinnati stroke populations, and NHANES for age 20 to 54 y
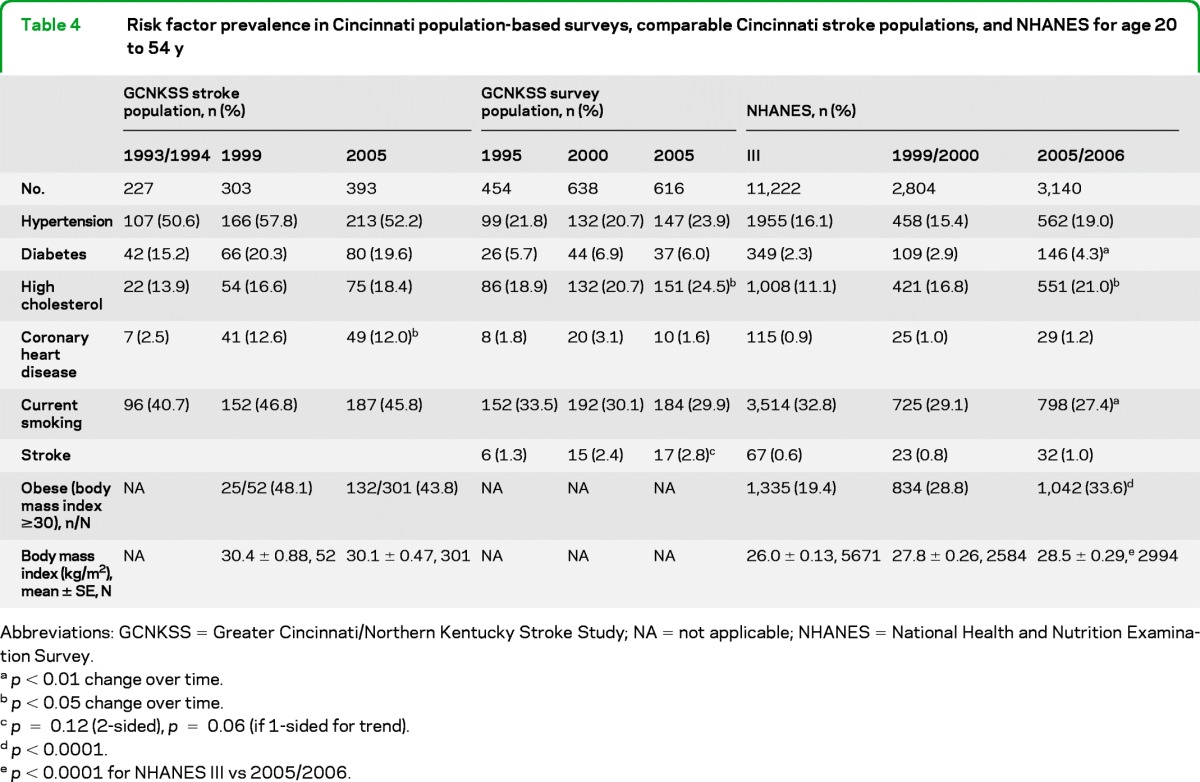
Abbreviations: GCNKSS = Greater Cincinnati/Northern Kentucky Stroke Study; NA = not applicable; NHANES = National Health and Nutrition Examination Survey.
a
p < 0.01 change over time.
b
p < 0.05 change over time.
c
p = 0.12 (2-sided), p = 0.06 (if 1-sided for trend).
d
p < 0.0001.
e
p < 0.0001 for NHANES III vs 2005/2006.