
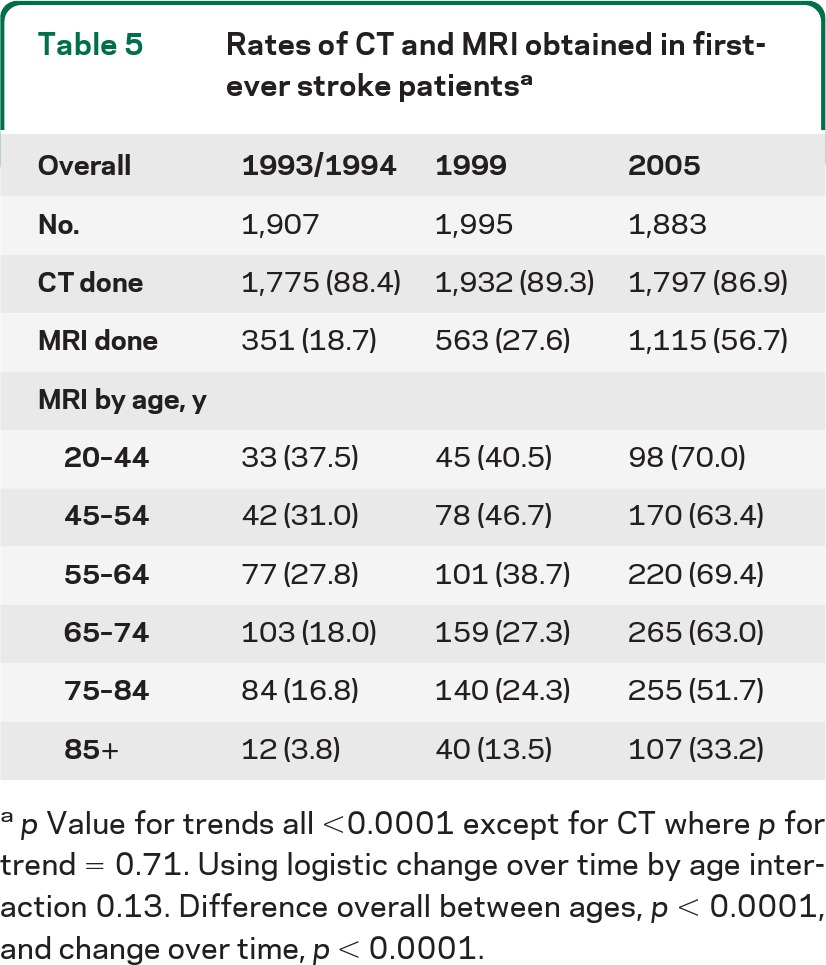
Table 5.
Rates of CT and MRI obtained in first-ever stroke patientsa
a
p Value for trends all <0.0001 except for CT where p for trend = 0.71. Using logistic change over time by age interaction 0.13. Difference overall between ages, p < 0.0001, and change over time, p < 0.0001.