
Figure 1.
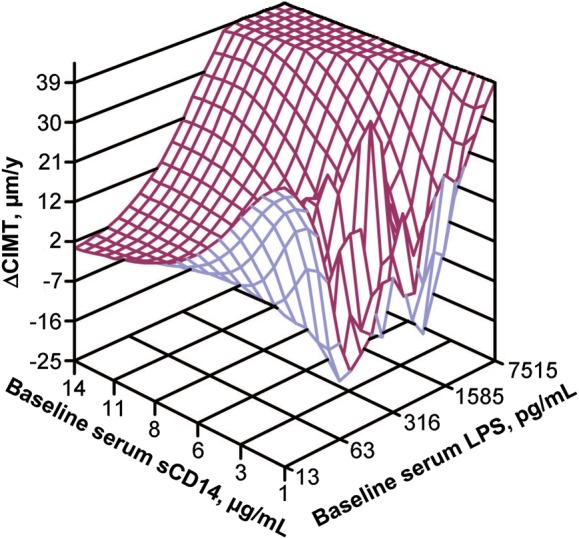
Three-dimensional surface plot illustrating the relationship of the yearly rate of change in carotid artery intima-media thickness (ΔCIMT) (z-axis) with baseline levels of soluble CD14 (sCD14) (x-axis) and baseline levels of lipopolysaccharide (LPS) (y-axis) for the 55 human immunodeficiency virus–infected subjects in the study.