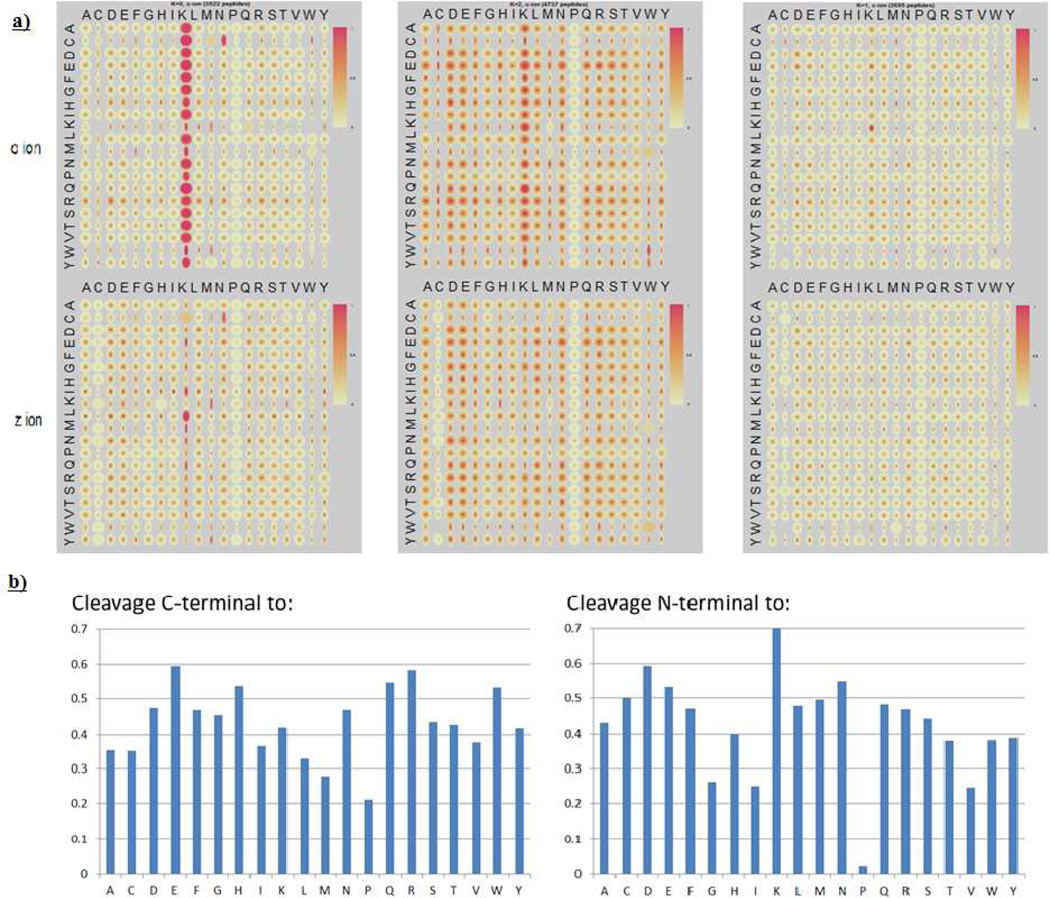
Figure 1.
a) Quantile maps for the three clusters obtained by K-means clustering of 11954 spectra of Lys-C digested unique peptides. Two quantile maps are plotted for each cluster, one for c ions (top) and one for z ions (bottom); b) Quantified cleavage preference in Cluster 2. The left graph represents the cleavage C-terminal to a certain residue and the right graph represents the cleavage N-terminal to a certain residue. Cleavage preference (y axis) is represented by the probability for a certain amino acid pair to have strong cleavages (reference 9 for detailed calculation), e.g., cleavages C-terminal to E, H, N, Q, R and W are relatively strong, and cleavages N-terminal to G, I, V are rather weak.

