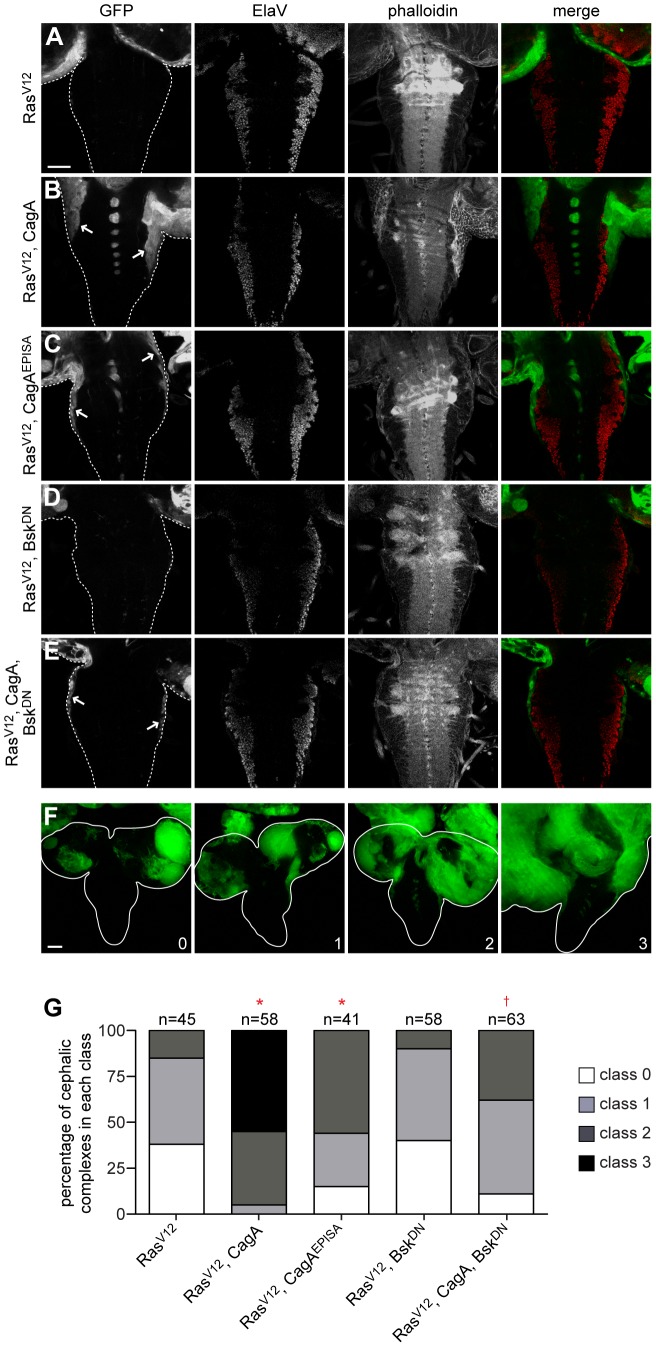
Figure 5. CagA enhances tumor invasion through JNK activation.
(A–E) Confocal cross sections of cephalic complexes from third instar larvae with GFP-marked tumors stained with an antibody against ElaV to mark terminally differentiated cells and phalloidin to reveal f-actin structure. VNCs are outlined in panels showing GFP expression, and arrows highlight invading tumor tissue. Expressing RasV12 alone in whole eye clones (A) causes a mild invasive phenotype characterized by either no invasion or migration of tumor cells from one optic lobe. Coexpression of CagA with RasV12 (B) dramatically enhances the extent of VNC invasion from both optic lobes, while coexpression of CagAEPISA with RasV12 (C) shows a milder enhancement of invasion. Coexpression of BskDN with RasV12 (D) does not significantly affect the invasive capacity of tumor cells, while coexpression of BskDN with RasV12 and CagA (E) suppresses the VNC invasion phenotype. Scale bar, 50 µm. (F) Projections of several confocal cross sections from third instar larval cephalic complexes with GFP-marked tumors showing different classes of invasiveness: (0) noninvasive, (1) invasion from one optic lobe, (2) invasion from both optic lobes, (3) significant invasion of the VNC. Brain lobes and ventral nerve cords are outlined. Scale bar, 50 µm. (G) Quantitation of the percentage of cephalic complexes classified into each category. The number of samples analyzed is shown above each column. * indicates a distribution that differs significantly compared to RasV12; † indicates a distribution that differs significantly compared to RasV12, CagA; p<0.0001.

