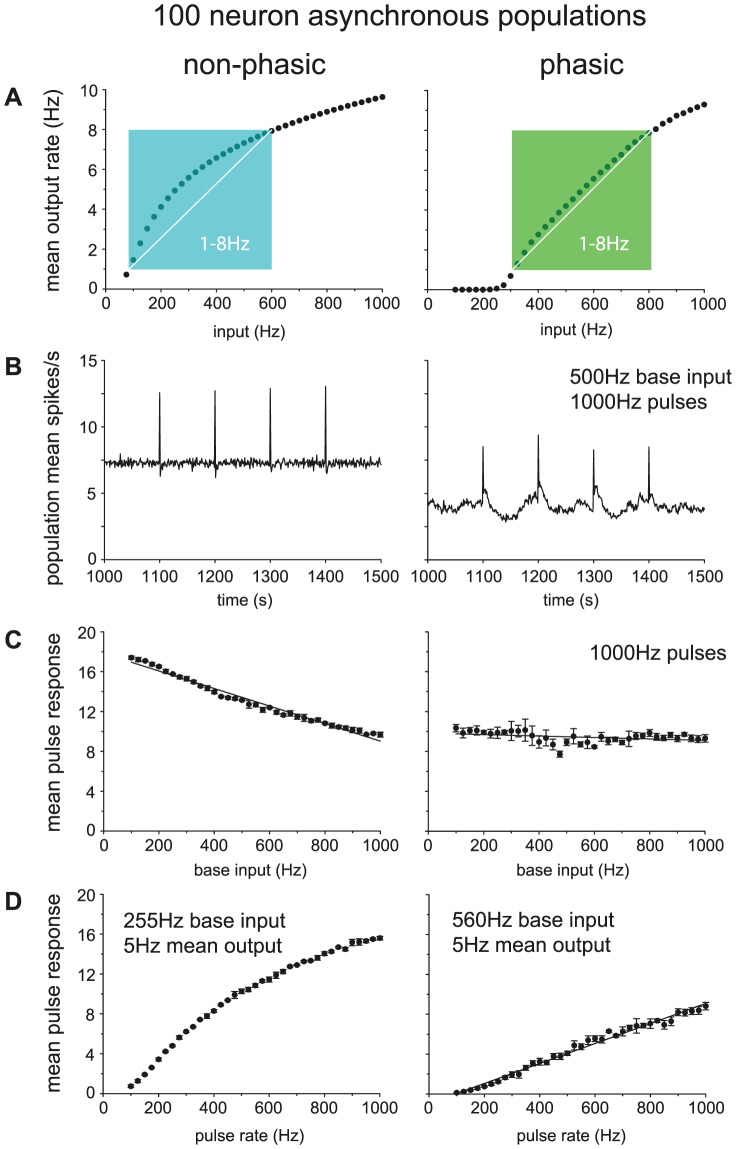
Figure 9. Comparing the population spike response of phasic and non-phasic model cells.
Data here is from a population of 100 identical model cells (using the fit to cell v1) run in parallel, taking as output the summed spike rate. Synaptic input uses a common rate parameter, I re, but was generated independently for each neuron, maintaining an asynchronous population. Non-phasic cells use gL = 0. To test pulse response, I re, was set to a defined pulse input for 1s at four time points spaced 100s apart. The pulse response was measured as the mean population spike rate response over the four pulses. (A) Mean population rate with a varied base input rate (range 100–1000). The population response in the phasic cells, shows a much more linear relation to the input, once input is sufficient to trigger phasic firing, particularly in the physiological spiking range of 1–8Hz. (B) Population spike activity in non-phasic and phasic cells with matched 500Hz base input rate and 1000Hz pulse input. The summed asynchronous bursting activity in the phasic cells does not show the bursting, but does show more variable activity and a lower mean spike rate. Each input pulse produces a distinct increase in firing rate. (C) Testing response with a varied base input rate (range 100–1000) and fixed 1000Hz pulse input. As background input increases, the mean pulse response in the non-phasic cells gradually falls, whereas in the non-phasic cells it is much more consistent. (D) Testing response with varied pulse input rate (range 100–1000Hz) and base rate set to give matched mean firing rate = 5 spikes/s (non-phasic base I re = 255, phasic base I re = 560). The phasic population response shows a much more linear relation to the input pulse rate.

