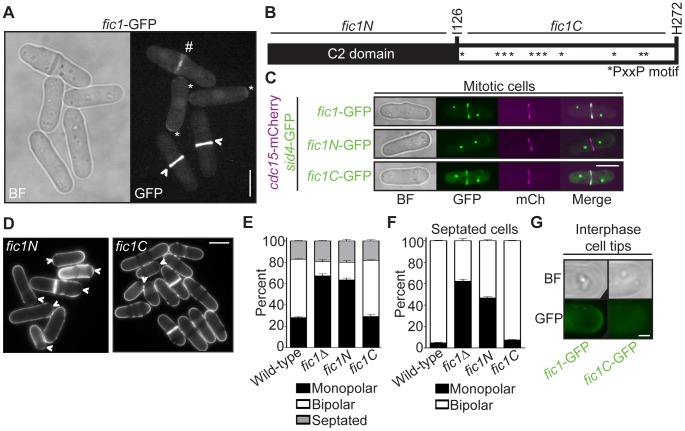
Figure 3. Fic1's C terminus is necessary and sufficient for Fic1's polarity function at the division site.
(A) Live-cell bright field (BF) and GFP images of fic1-GFP cells. Localization to cell tips (*), the cytokinetic ring (>), and the division site (#) are marked. (B) Schematic of Fic1 protein domain organization. Residues and fragments of interest are marked. (C) Live-cell BF, GFP (in green), mCherry (mCh) (in magenta), and GFP/mCherry merged images of fic1-GFP sid4-GFP cdc15-mCherry, fic1N-GFP sid4-GFP cdc15-mCherry, and fic1C-GFP sid4-GFP cdc15-mCherry cells. (D) Live-cell images of calcofluor-stained fic1N and fic1C cells. Arrowheads indicate monopolar cells. (E) Quantification of (D), with three trials per genotype and n>300 for each trial. Data are presented as mean ± SEM for each category. (F) Quantification of septated cells in (D) and (E), with three trials per genotype and n>200 for each trial. Data are presented as mean ± SEM for each category. (G) Live-cell BF and GFP images of interphase cell tips of fic1-GFP and fic1C-GFP cells (Bars = 5 µm, except for 3G where Bar = 1 µm).

