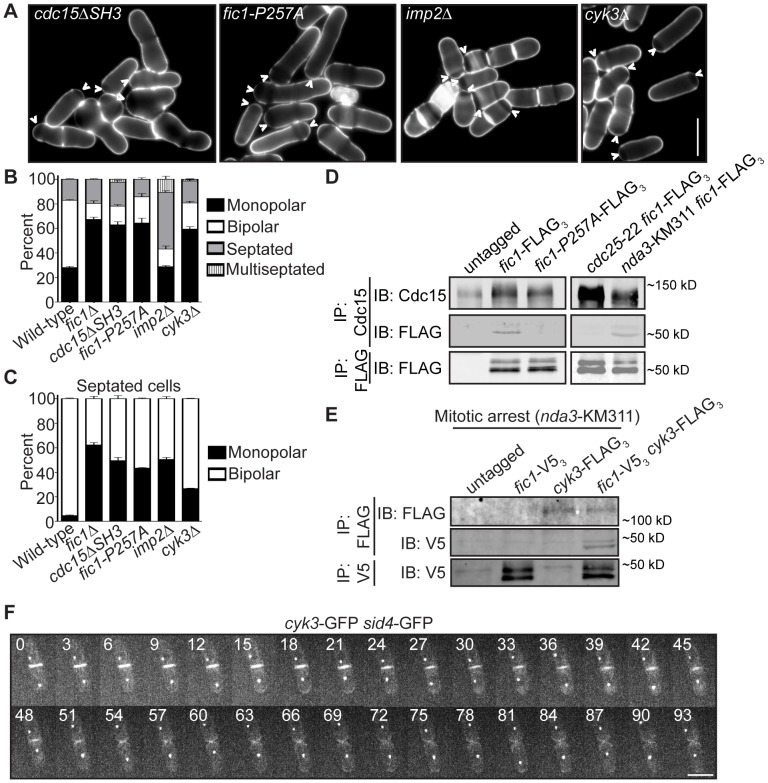
Figure 4. Fic1 participates in protein–protein interactions at the CR that guide subsequent growth polarity.
(A) Live-cell images of calcofluor-stained cdc15ΔSH3, fic1-P257A, imp2Δ, and cyk3Δ cells. Arrowheads indicate monopolar cells. (B) Quantification of (A), with three trials per genotype and n>300 for each trial. Data are presented as mean ± SEM for each category. (C) Quantification of septated cells in (A) and (B), with three trials per genotype and n>300 for each trial. Data are presented as mean ± SEM for each category. (D) Anti-Cdc15 and anti-FLAG immunoprecipitates from cells of the indicated genotypes were blotted with anti-Cdc15 and/or anti-FLAG antibodies. cdc25-22 cells and nda3-KM311 cells were arrested in G2 and prometaphase, respectively, prior to pelleting and lysis. (E) Anti-FLAG and anti-V5 immunoprecipitates from prometaphase-arrested cells of the indicated genotypes were blotted with anti-FLAG and/or anti-V5 antibodies. (F) Live-cell GFP movie of a cyk3-GFP sid4-GFP cell, with images every 3 min (Bars = 5 µm).

