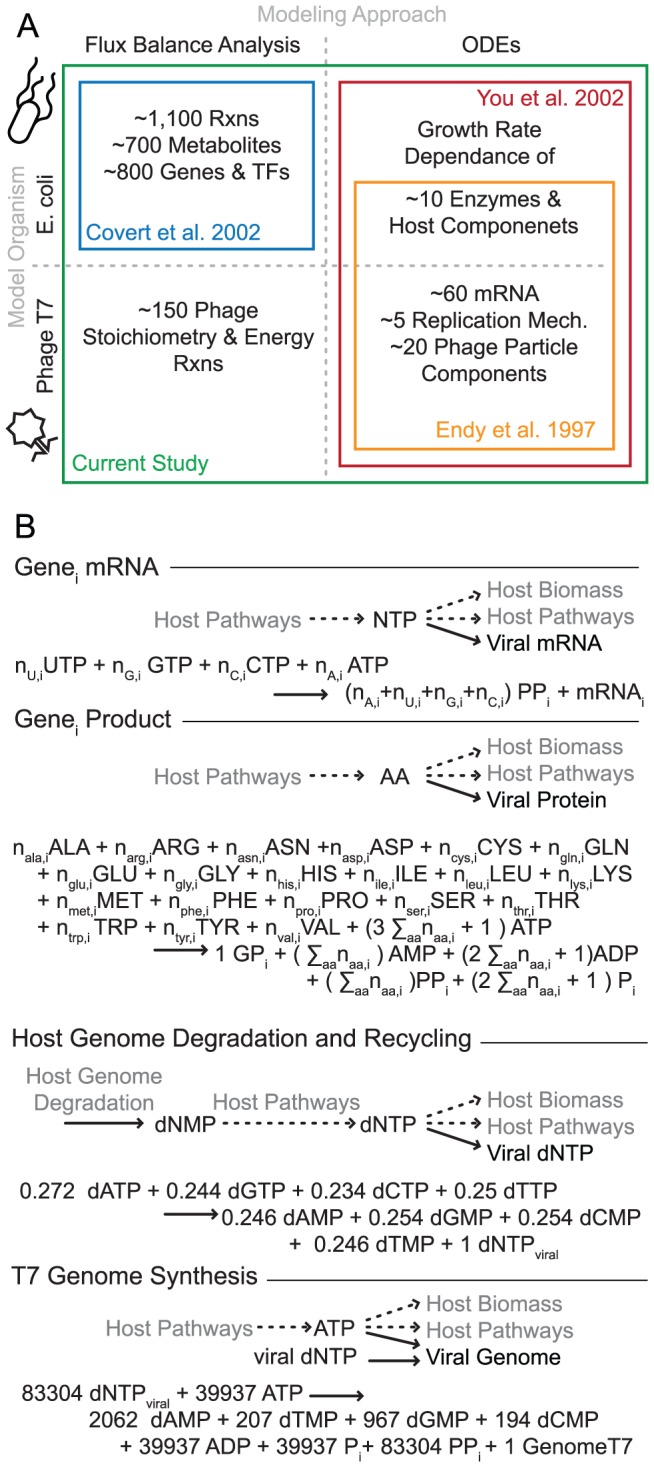
Figure 1. Model approaches, scopes, and additions used in the current integration.

(A) The computational methods and the organisms represented by previous modeling efforts that are combined in this study. (B) The additional reactions constructed in this study for the purpose of translating T7 ODE reaction rates into host metabolite use. Shown at the top for each category is a schematic of metabolite connections to host metabolism, and under it the full stoichiometric reaction, which may be a formula based on nucleotide or amino acid sequence (the gene designations  taking both decimal and integer values in correspondence with the naming of T7 genes [36], a total of n = 59 included). Assumptions made in formulating the reactions are expanded in Methods and SI, and the metabolite abbreviations used are consistent with the FBA model definition.
