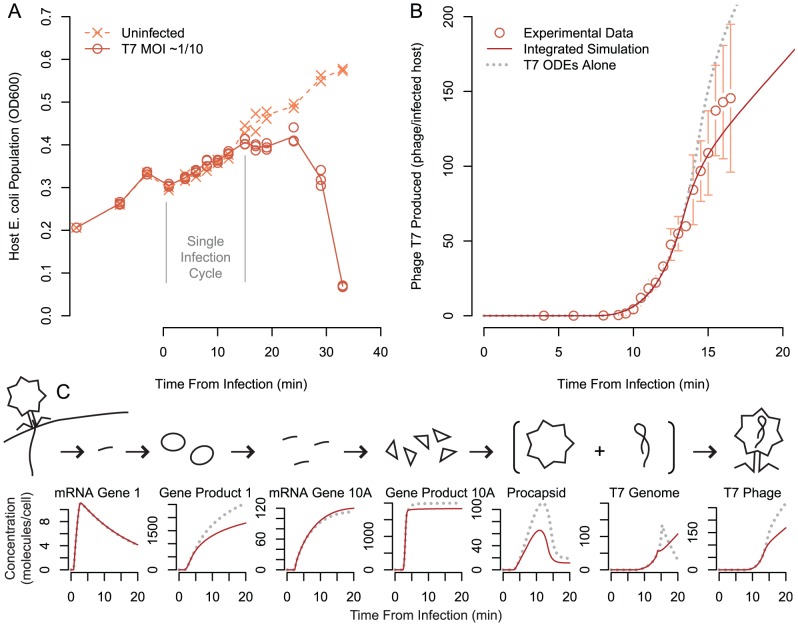
Figure 3. Host population and phage population time courses.
(A) Dynamic time courses of experimental host population data uninfected (line is mean of n = 2) and infected cultures (line is mean of n = 3); an immediate drop in population density occurs when the solution of phage is added at  , due to dilution. Initial infection multiplicity was 0.1. (B) Measured and simulated phage production per infected host in tryptone broth media (circles are mean, error bars shown are the standard deviation, n = 3). Simulation presented for the integrated model and T7 ODEs alone simulated at
  . (C) Expanded comparison of the simulated concentrations of critical phage replication machinery and phage virion components compared to T7 ODEs alone. Gene Product 1 is the T7 RNA polymerase; Gene product 10A is the major capsid protein.

