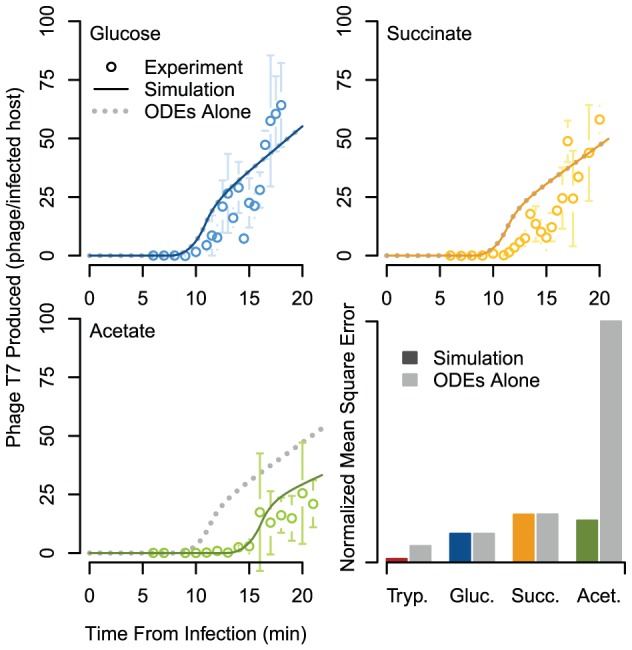
Figure 5. Measured and simulated phage production.

Shown per infected host, across time, experiment compared to model predictions for integrated model system, and the T7 ODEs alone, on M9 minimal media with glucose, succinate, or acetate as carbon source (growth rates for T7 ODEs alone are  , respectively). Error bars are standard deviation of n = 3. For glucose and succinate media the T7 ODEs time course is not visible because it falls directly beneath the integrated simulation line. The lower right panel quantifies the goodness of fit of the integrated simulation and the T7 ODEs alone to experimental observations using normalized mean squared error.
