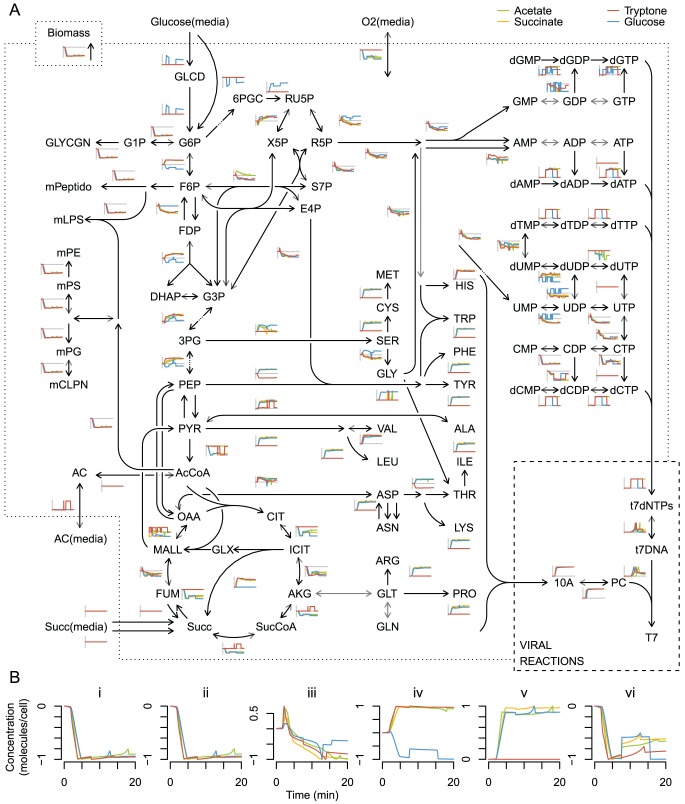
Figure 6. Comparing normalized infected host flux dynamics spark-lines for all four media.
(A) Metabolic map and normalized flux dynamics for tryptone, glucose M9, succinate M9, and acetate M9 media. Flux values were shifted to the uninfected value ( ), and then normalized to their maximum magnitude on each medium; zero (initial) value is indicated by a grey horizontal line. Metabolite abbreviations are consistent with FBA model definition. (B) Expansion of a selected subset of normalized fluxes. Host cell envelope synthesis (i), and biomass accumulation (ii) decrease similarity across media. Purine synthesis (iii) exhibits dynamic similarity across media. Glycolysis (iv) is observed on glucose while gluconeogenisis occurs on other media. Amino acid synthesis (v) increases on minimal media but not on amino acid-rich tryptone; and the citric acid cycle (vi) demonstrates similarity in dynamic flux change timing, but differences in scaling and direction.

