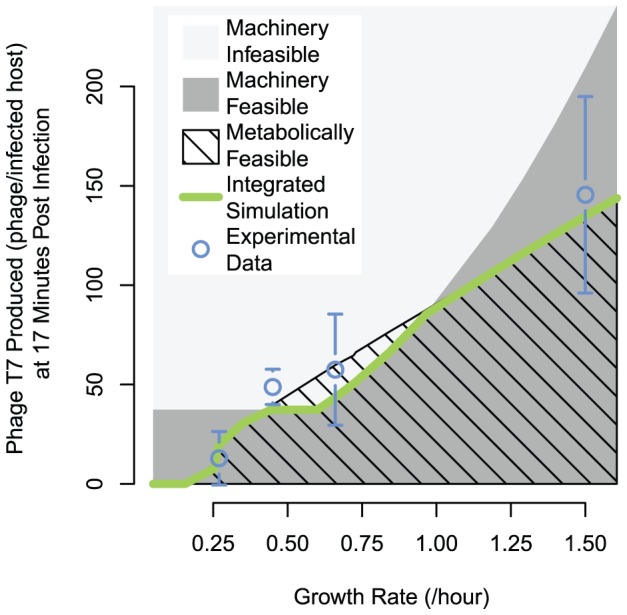
Figure 7. Variation in the limiting factor for phage production across host growth rates.

Modeling results overlaid with experimental phage production measurements. The machinery-feasible region represents phage production values from T7 ODEs alone, with the growth rate supplied to correlations for availability of the host replication machinery; phage production values above the machinery-feasible boundary are considered machinery infeasible. The upper boundary of the metabolically feasible region was calculated using the integrated simulation, but with access to excess host replication factors, which we simulated by multiplying the host growth rate from FBA by a factor of 1.25 when it was passed to the T7 ODE host machinery correlations. Growth rate variation for calculating limitation boundaries and integrated simulation was evaluated with a set of modified flux bounds, with most growth rate sampling values simulated with both carbon and oxygen limitation, which produced essentially identical phage production predictions (resulting points lie within width of the line displayed). Error bars are standard deviation of n = 3.
