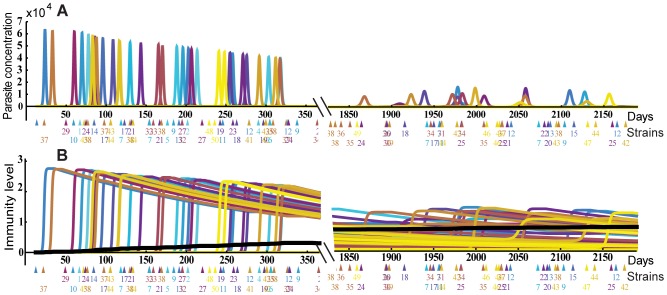
Figure 4. Evolution of immunity over time.
Panel A. The results of a stochastic simulation of acquired immunity are shown for one in silico individual. Bites (coloured triangles) occur randomly with a fixed biting rate, and different strains (coloured, and numbered below) initiate infection. Each infection induces and is cleared by strain-specific immunity (Panel B), which then wanes over time. General immunity (solid black line) accumulates slowly over time. The accumulation of immunity in the first year (left panels) and aged 5–6 years (right panels) is shown.

