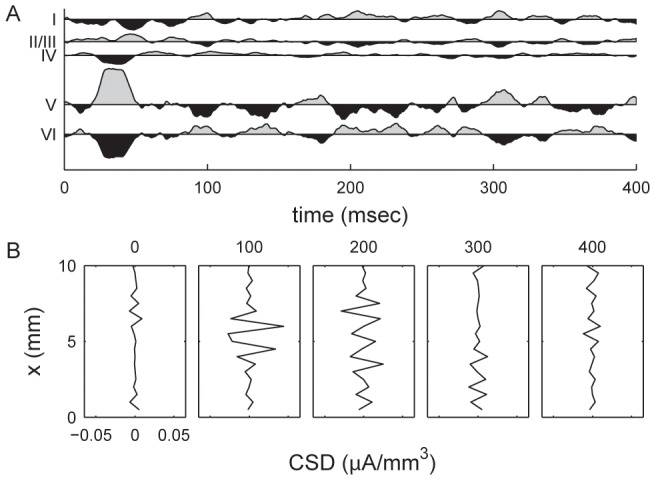
Figure 7. Current source densities (CSD) generated by the LCM.

Shown are (A) CSDs for the central elements of each cortical layer, and (B) temporal profile for current source density of the central line of layer IV (see Figure 6). The CSD plots show the difference between CSD at each time point and the mean value in the entire epoch. Time values are in milliseconds after the onset of transient LGN input. A positive CSD value indicates a current source. Results are calculated from the same dataset as Figure 6.
