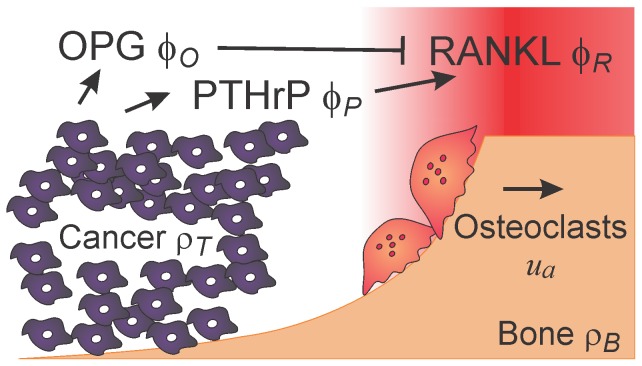
Figure 2. Model geometry.
Active osteoclasts ( ) resorb bone (
 ) along the gradient (red) of the RANKL field (
 ), and move from left to right. The tumor (
 ) invades the space previously resorbed by active osteoclasts. Cancer cells produce PTHrP (
 ), which diffuses and induces the expression of additional RANKL by osteoblastic bone cells. Cancer cells also produce OPG (
 ) which diffuses, inhibits RANKL, and hence modifies the RANKL–gradient.

