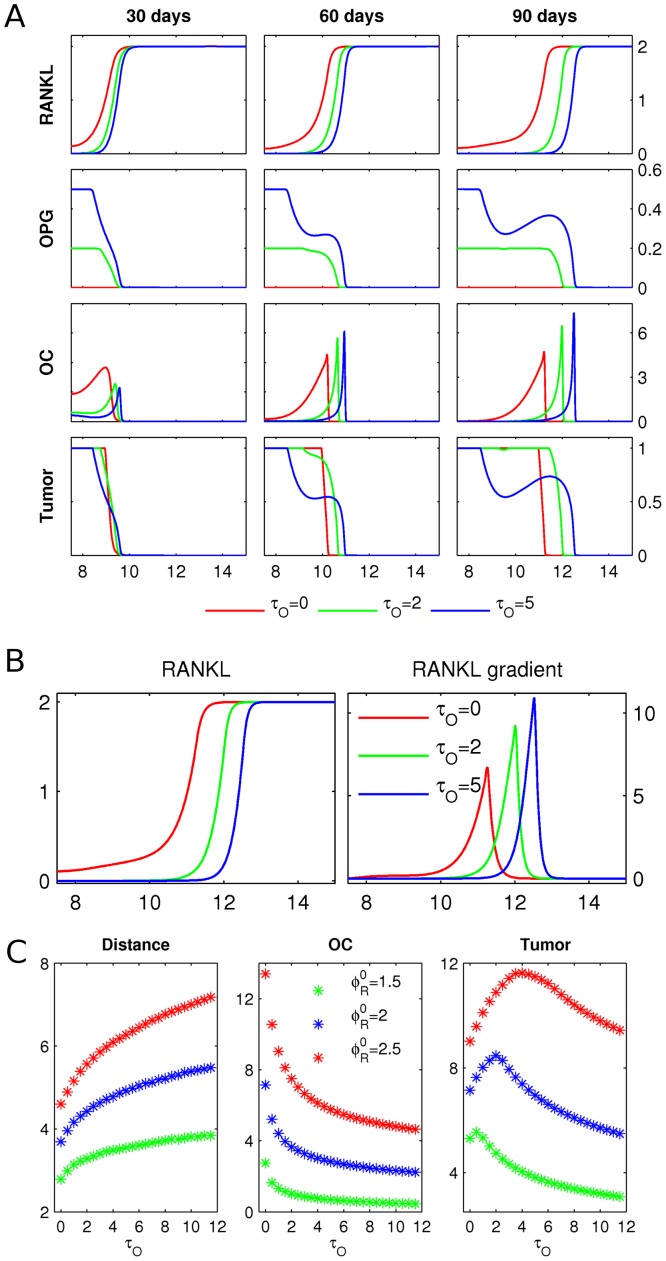
Figure 5. OPG production by tumor.
A Starting from the initial conditions described in Figure 3, the RANKL and OPG concentrations, the osteoclast population density (OC) and the tumor density (Tumor) are shown after 30, 60 and 90 days, respectively. The growing tumor produces OPG at rates  (green) and
  (blue), with a control case
  (red). Length of domain is
  , and only the right halves of the symmetric fields are shown. Scales are as in Figure 4, and OPG is in pmol/mm. B
Left: zoom in on RANKL at 90 days in panel A. Right: the RANKL gradients are obtained by taking the spatial derivatives of the respective fields. C The simulation described in panel A is repeated for different initial RANKL levels
  , and different levels of OPG production by cancer cells
  . After 90 days, the following quantities are shown: distance traveled by osteoclasts (Distance), total number of active osteoclasts (OC), and total tumor mass (Tumor).

