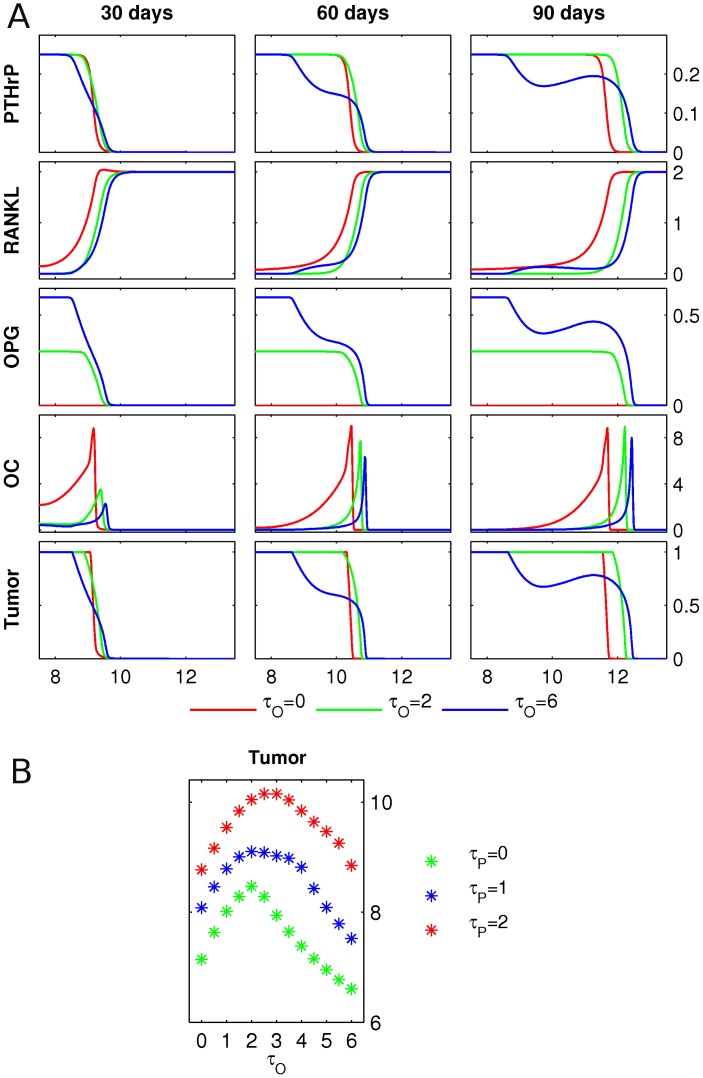
Figure 8. PTHrP and OPG production by tumor.
A Starting from the initial conditions described in Figure 3, the PTHrP, RANKL and OPG concentrations, the osteoclast population density (OC) and the tumor density (Tumor) are shown at 30, 60 and 90 days, respectively. The initial RANKL level is  . The growing tumor produces PTHrP at a fixed rate
  , and three different levels of tumor-derived OPG production
  are considered. Length of the domain is 15 mm, only the right halves of the symmetric fields are shown. Units of the y-axes are as in Figure 7, and the OPG field has units of
  . B The simulation described in panel A is performed for varying values of
  and
and  , and the total tumor mass at 90 days is presented.

