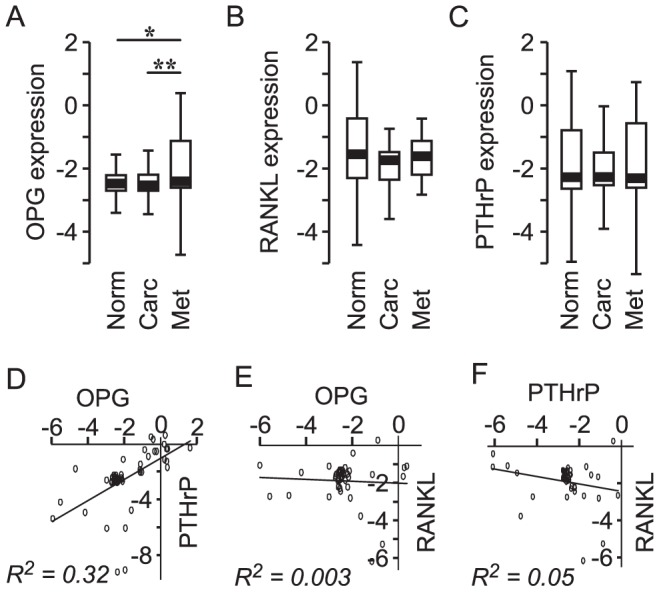
Figure 9. OPG, RANKL and PTHrP expression in prostate cancer.

Data from nine gene expression data sets [47]–[55] were combined and analyzed. A–C Expression of OPG (A), RANKL (B) and PTHrP (C) are shown in the box-plots where the lower whisker indicates the 1st percentile, the limits of the box indicate the 25th and 75th percentiles, and the upper whisker indicates the 99th percentile. Statistical significance is indicated by  ,
,  , calculated using one-way ANOVA. D–F Data for the metastatic prostate samples were analyzed for the correlation in the expression of OPG and PTHrP (D), OPG and RANKL (E), and RANKL and PTHrP (F).
