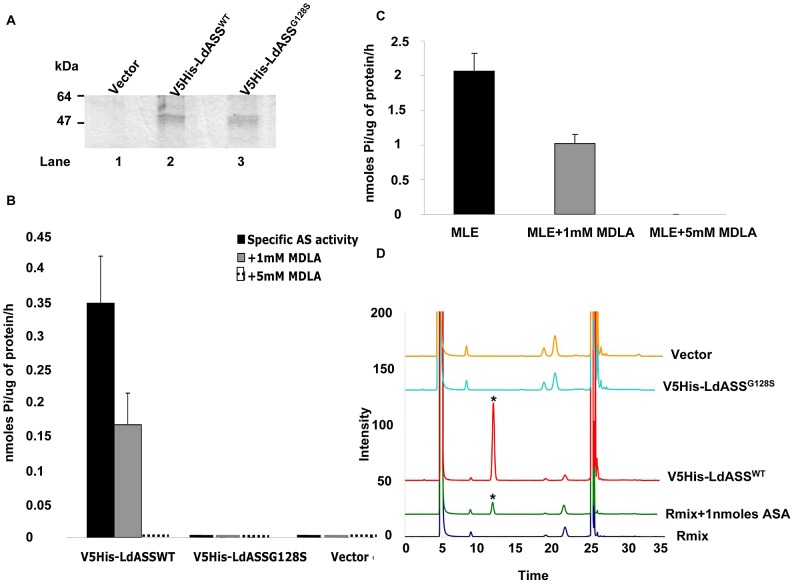
Figure 2. ASS activity assay.
(A) Sample of recombinant ASS proteins affinity purified from 108 cells of vector control (lane 1), V5His-LdASSWT (lane 2) and V5His-LdASSG128S (lane 3) over expressing parasites using Ni-NTA resin beads, analyzed on an SDS gel and visualized with Gel code blue staining. (B) ASS activity measured by release of Pi in the presence of aspartate and citrulline substrates, obtained with Leishmania recombinant ASS proteins purified from the over expressing cell lines, in the absence (black bars), or presence of 1 mM (grey bars) or 5 mM of inhibitor (interrupted line). (C) Activity determined for Mouse Liver Extract (MLE) as a positive control for the assay. (D) HPLC analysis: Fluorescence intensity of OPA labeled components of ASS enzyme reaction. Overlay of elution profiles showing resolution of ASA (blue line: reaction mix, green line: 1 nmoles of ASA mixed with the reaction mix, red line: pulled down protein from V5His-LdASSWT cell line and incubated in presence of the reaction mix, turquoise line: pulled down protein from V5His-LdASSG128S cell line incubated in presence of the reaction mix, orange line: pull down from vector control incubated in presence of the reaction mix. The star indicates the ASA peak. The graphs shown are representative of 3 replicates of the assay.

