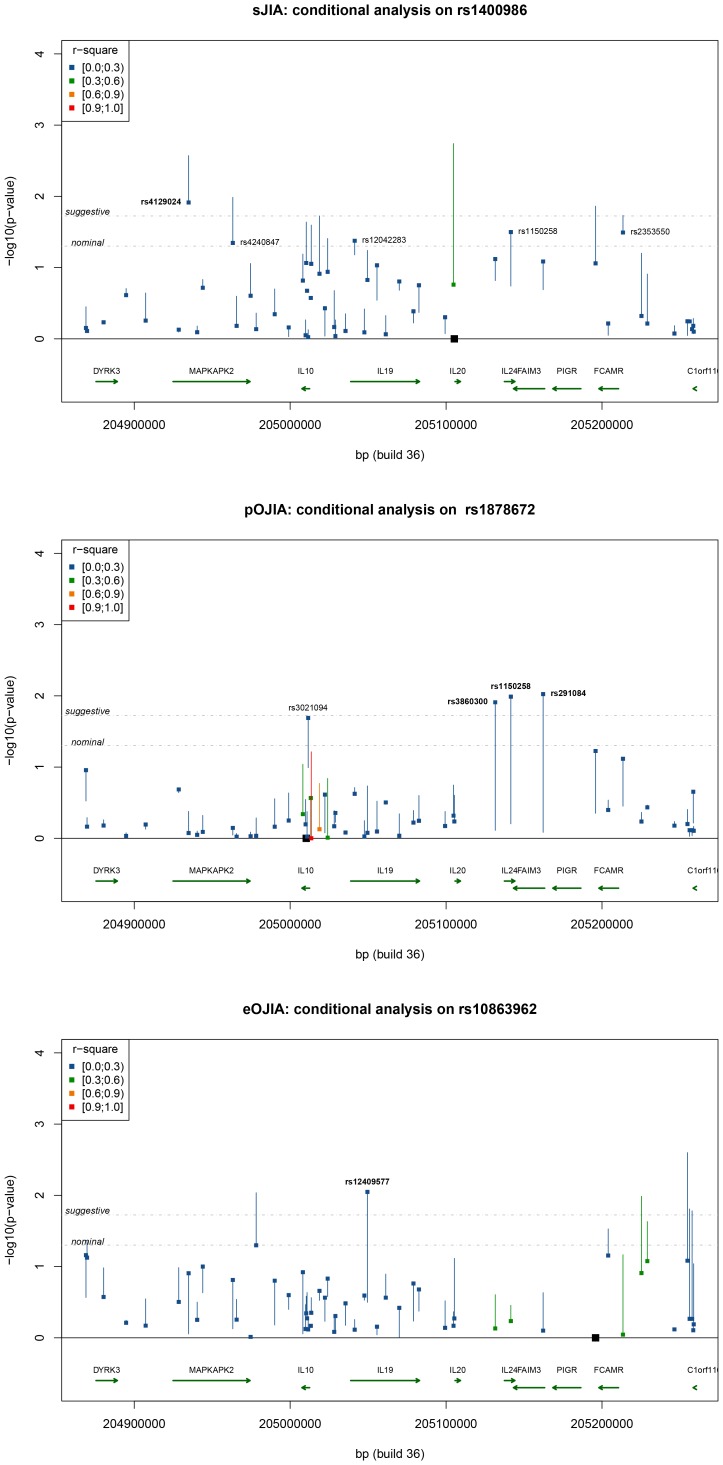
Figure 3. Conditional analysis on the most significant SNPs for each JIA subtype.
For each SNP, the square represents the p-value after adjusting for the effect of the conditioned SNP, while the other end of the line shows the p-value of a single-locus analysis, prior to conditioning. Colours show the range of r2 between the conditioned SNP and the tested SNP as indicated in the insert. Location of the conditioned SNPs is indicated by a black square. Thresholds are indicated for nominal (p = 0.05), suggestive (p = 0.0189) thresholds, with tSNPs above suggestive threshold indicated in bold.

