
Figure 2. PROSA plot for the obtained SP-G structure model.
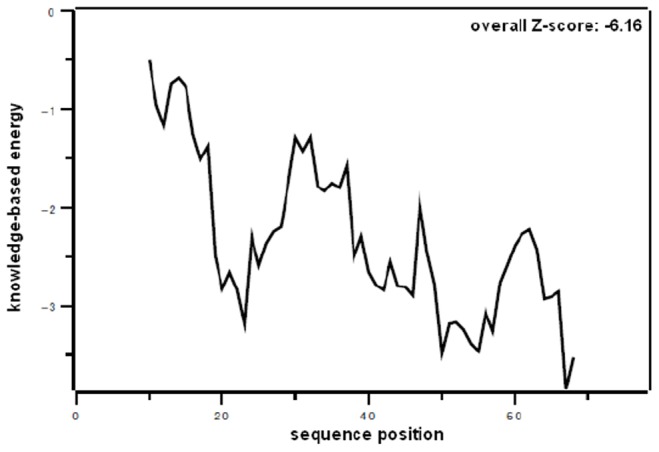
The combined pair and surface potential is plotted versus the sequence position. The completely negative curve and the overall Z-score of −6.16 suggest a native-like fold.
Official websites use .gov
A
.gov website belongs to an official
government organization in the United States.
Secure .gov websites use HTTPS
A lock (
) or https:// means you've safely
connected to the .gov website. Share sensitive
information only on official, secure websites.
The combined pair and surface potential is plotted versus the sequence position. The completely negative curve and the overall Z-score of −6.16 suggest a native-like fold.