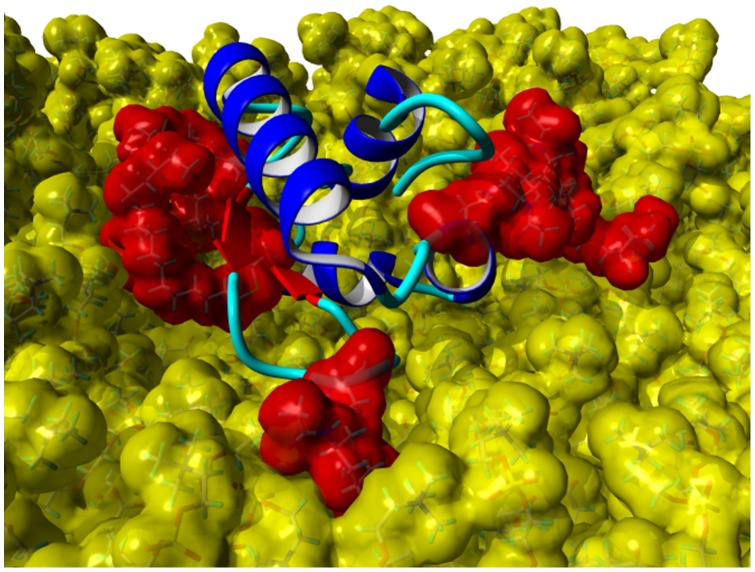
Figure 12. Posttranslationally modified SP-G model with DPPC monolayer after 50 ns MD simulation.
The lipids are shown with a yellow, the posttranslational modifications at position 37, 62, 70, 76, and 78 are shown with a red van der Waals surface to illustrate the tight interactions. Furthermore, the protein backbone is shown with the ribbon presentation (α-helices: blue; β-sheets: red, coil: cyan).

