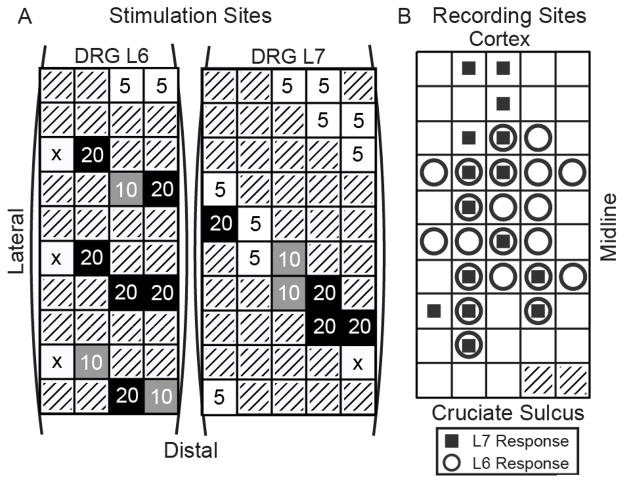
Fig. 1.
A: Spatial layout of the stimulus amplitude threshold (μA) for evoking a significant cortical response (vs. baseline) on each tested stimulus channel for the L6 and L7 DRGs. Threshold at any stimulus rate counted as being at threshold for the reported stimulus amplitude. An ‘x’ indicates that no stimulus amplitude/rate pair was sufficient to elicit a cortical response. Gray boxes represent disconnected channels. B: Spatial pattern of responses in S1 to 5 μA stimulation. Circles and squares indicate that a response was elicited by at least one electrode in the L6 or L7 DRG, respectively.

