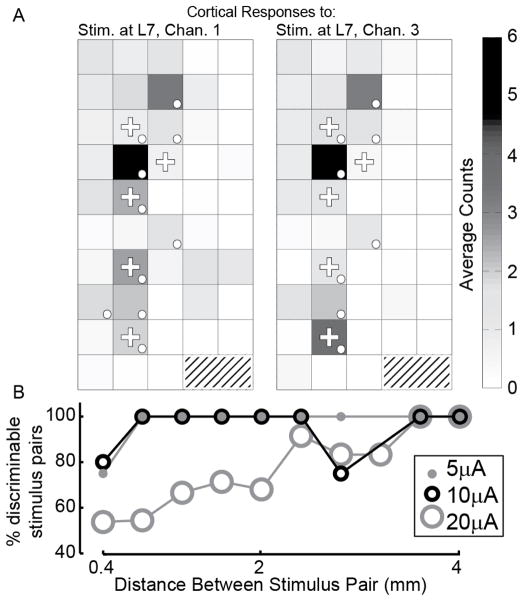
Fig. 3.
Discriminability of S1 responses evoked by stimulation at different locations, pulse rates, and amplitudes. A: Examples of the average cortical response to stimulation on channels 1 (left) and 3 (right) in the L7 DRG at 5 μA and 100 pps. Shown is the average spike count observed 10 – 60 ms following stimulus onset. Dots denote channels showing a significant response; plus symbols (+) indicate channels used for classification. Although they have similar average responses, they can be classified with 90% accuracy. B: Percentage of channel pairs that evoked discriminable S1 responses as a function of the separation distance between the 2 stimulation sites (rate = 100 pps). Only stimulus electrodes that evoked significant responses vs. baseline were included. Pairings were kept within arrays. Distances have been grouped to nearest 0.4 mm.

