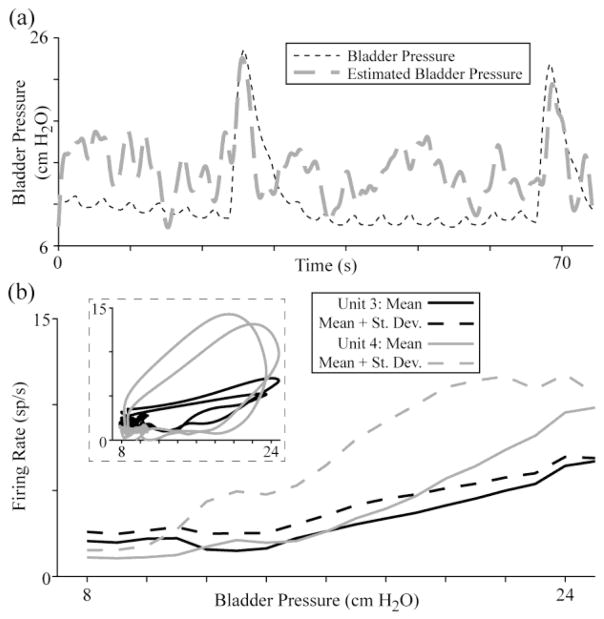
Fig. 5.
Example bladder pressure estimation trial using a regression model from a prior trial. (a) The RMSE for estimating trial 1–2 from a model based on trial 1-1 was 4.4 cm H2O for 10 units (shown here; ρ = 0.55) and 5.2 cm H2O for 5 units (ρ = 0.69). (b) Many bladder units have varying firing rate response curves during rapid changes in pressure and for different bladder pressure ranges. Here, the mean firing rate at each pressure value and (inset) firing rate against pressure at each time point are shown for units 3 and 4 (corresponding to trial 1–2, Fig. 2).

