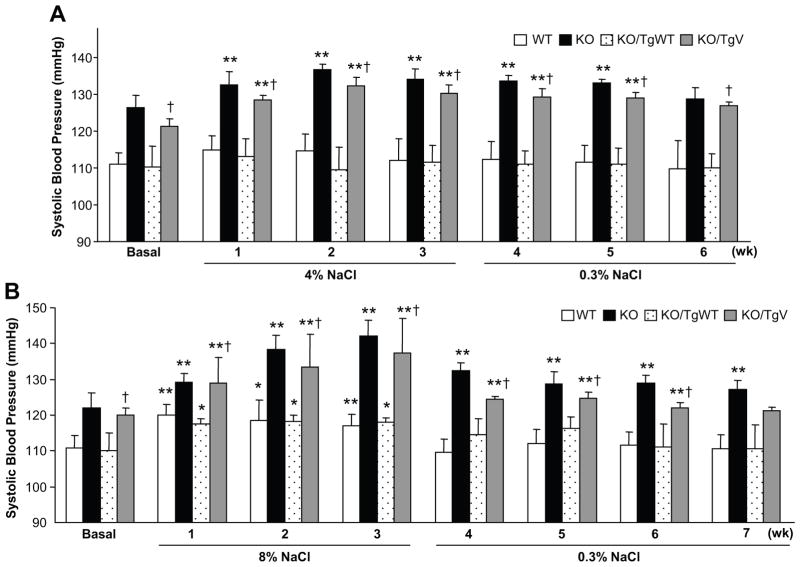
Figure 4. Salt-sensitive hypertension in corin KO/TgV mice.
(A) Tg mice on a 0.3% NaCl diet (basal) were switched to a 4% NaCl diet for 3 weeks (wk) and then back to the 0.3% NaCl diet. SBP data from 6–10 mice per group are shown. Corin WT and KO mice were included as controls. (B) Similar studies were conducted in the Tg mice on an 8% NaCl diet. SBP data from 4–6 mice per group are shown. *p<0.05 or **p<0.01 vs. basal of the same genotype; †p<0.01 vs. KO/TgWT of the same group by two-way ANOVA.

