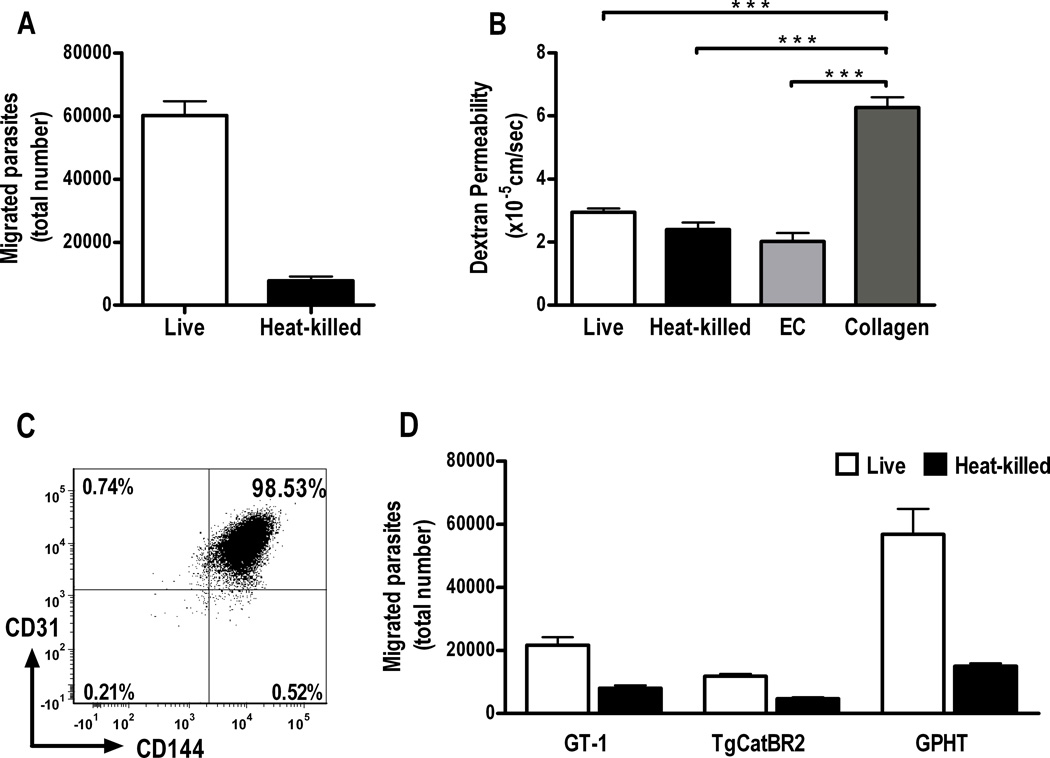
Figure 1. Toxoplasma gondii tachyzoites transmigrate a simulated human retinal vascular endothelium.
(A) Graph showing number of tachyzoites recovered from lower chambers of transwells divided by a human retinal endothelial monolayer cultured on type 1 collagen, 4 hours after upper chambers were loaded with 1 × 10⁶ live or heat-killed RH strain T. gondii tachyzoites (n=6 wells, parasite viability = 44%). Representative of two independent experiments.
(B) Graph showing dextran permeability of transwells presented in A, as well as dextran permeability of transwells incubated in parallel, but without tachyzoites, and containing endothelial monolayers or type I collagen alone. There was no significant difference in dextran permeability of transwells containing endothelial monolayers and incubated with live tachyzoites (live), heat-killed tachyzoites (heat-killed) or without tachyzoites (EC) (p > 0.05), but a highly significant difference between dextran permeability of these wells and wells containing membranes that were coated with collagen I alone (collagen) (***p < 0.001) (n=3–6 wells). ANOVA with post-hoc Tukey tests. Dextran permeability was determined in all experiments.
(C) Analysis of CD144 expression on human retinal endothelial cells cultured at confluence for 3 days, i.e., at least one day less than endothelial cells plated in transwells. Cells were gated on the basis of forward and side scatter to exclude debris and dead cells, and plotted for CD31 and CD144 expression. Numbers indicate percentage of gated cells expressing CD31 and/or CD144. Representative of two independent experiments. (D) Graph showing results of the same transmigration assay, conducted with three natural isolates (i.e., GT-1, TgCatBR2 and GPHT) in place of the RH laboratory strain (n=6 wells, parasite viability = GT-1, 58%; TgCatBR2, 27%; GPHT, 23%). Data were obtained in three independent experiments. In all graphs, bars represent mean and error bars represent standard error of mean.

