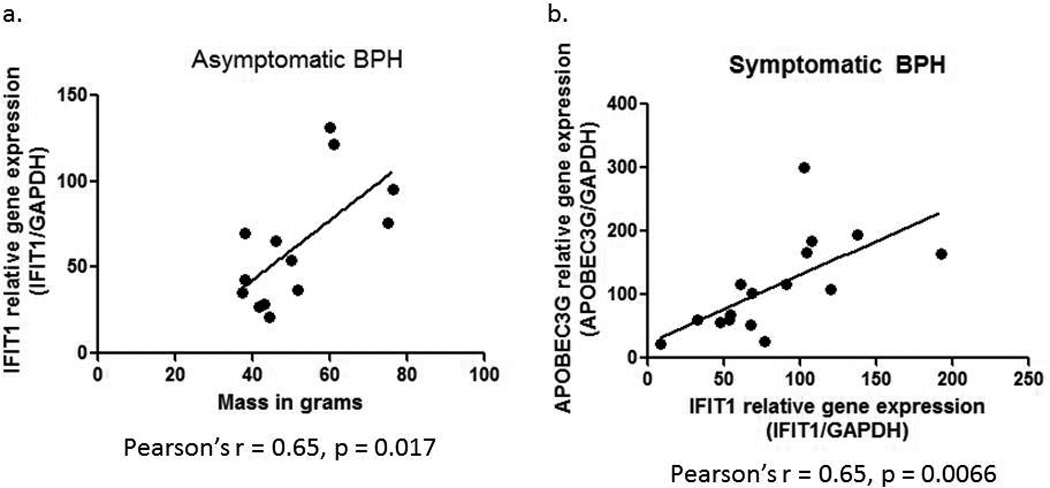
Figure 4.

a. Correlation between IFIT1 real time PCR results (IFIT1 relative gene expression – IFIT1/GAPDH) and mass in grams of the asymptomatic BPH samples. Statistical analysis was carried out using a Pearson’s correlation, with the Pearson’s r = 0.65 and p = 0.0172. b. Correlation between APOBEC3G and IFIT1 relative gene expression (normalized to GAPDH) in the symptomatic BPH samples. Pearson’s correlation statistical analysis resulted in a Pearson’s r = 0.65 and p = 0.0066.
