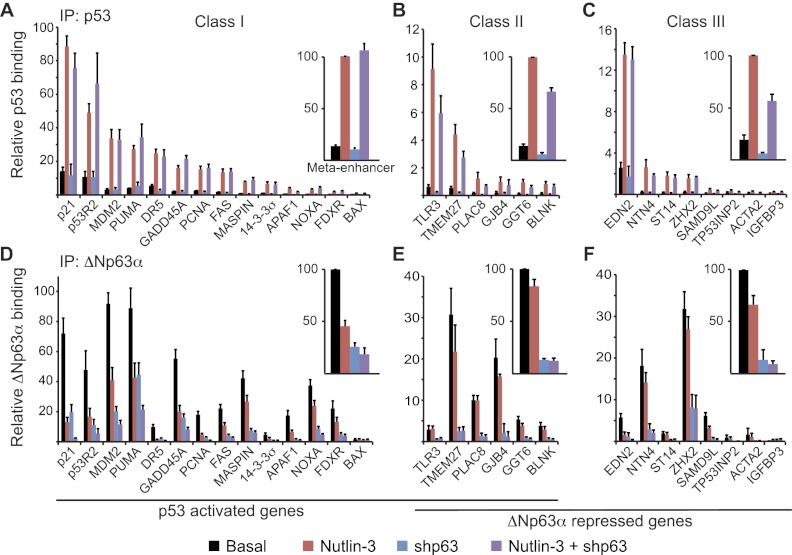
Figure 2.
ΔNp63α does not prevent p53 access to its genomic sites. ChIP assays were performed with whole-cell extracts from control cells (black bars) following 12 h of 10 μM Nutlin-3 treatment (red bars), 48 h of ΔNp63α knockdown (blue bars), or the combination of Nutlin-3 treatment and ΔNp63α knockdown (purple bars). Antibodies specific for p53 (A–C) and ΔNp63α (D–F) were used. ChIP-enriched DNA was quantified by real-time PCR for the p53/p63 response elements of each indicated gene. See Supplemental Figure 5 for gene maps and amplicon locations. Meta-enhancer values were calculated as the average PCR signal for each treatment group relative to Nutlin-3-treated (p53 IP) or basal (ΔNp63α IP) values for all response elements tested within a gene class.

