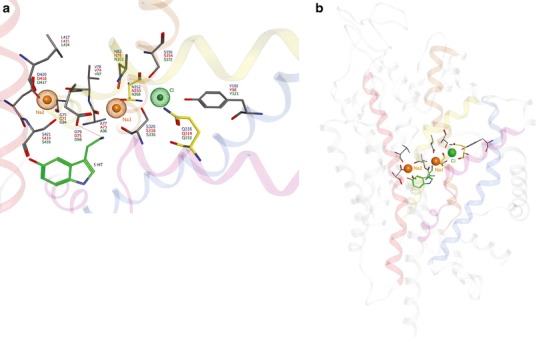
Fig. 4.

Proposed MAT ion binding sites. a Top and b side views of the sodium (orange) and chloride (green) binding sites are shown relative to S1 substrate position (serotonin; green). Participating side chains (atomtype) are annotated for hDAT (blue), hNET (red) and hSERT (green). Yellow side chains indicate a variance between the hSERT models of Zomot et al. ( 67). (Gln332) and Forrest et al. ( 45). (Asn368) with respect to the chloride ion binding site. The helices of TM1 (yellow), TM2 (blue), TM6 (pink), TM7 (brown) and TM8 (red) are involved in ion interactions
