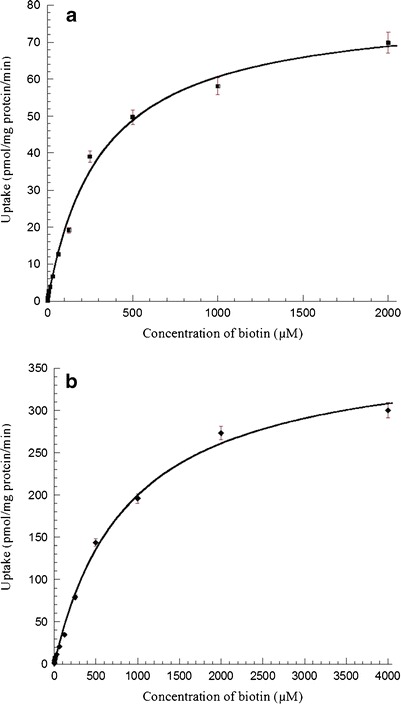
Fig. 3.

a Saturation kinetics of biotin uptake by HCEC cells at pH 7.4 in presence of different concentrations of unlabeled biotin (0.1–2,000 μM). Uptake was performed at 37°C for 30 min. Values represent mean ± SE (n = 4) of two independent experiments. b Saturation kinetics of biotin uptake by D407 cells at pH 7.4 in presence of different concentrations of unlabeled biotin (0.5–4000 μM). Uptake was performed at 37°C for 30 min. Values represent mean ± SE (n = 4) of two independent experiments
