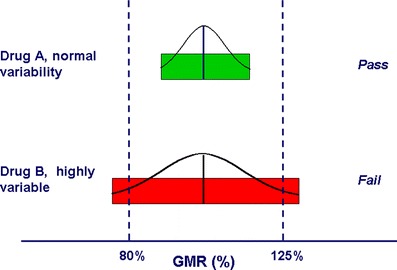
Fig. 1.

The 80–125% BE limits are represented along the x-axis as two “goal posts.” The BE limits are compared to the hypothetical 90% CIs of the test/reference BE measure GMRs for two drugs, a drug with normal variability (Drug A) and an HV drug (Drug B). The 90% CIs of the two drugs are represented by colored bars. For drug A (normal variability), the 90% CI (green bar) meets the BE limits. For drug B (HV), the 90% CI (red bar) fails to meet the acceptance limits. As the width of the CI is influenced by the number of study subjects, in the hypothetical case of drug B, it is likely that the study would have met the BE limits if more subjects had been used
