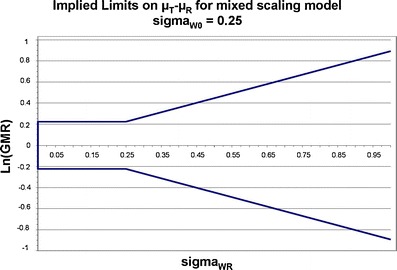
Fig. 2.

Implied BE limits are plotted as a function of the population reference product within-subject variability of the BE measure. When σ W0 ≤ 0.25, for an acceptable BE study, the 90% CI of the BE measure test/reference GMRs must fall within the 80–125% limits. When σ W0 > 0.25, the implied BE limits scale as reference product within-subject variability increases. The slope of this portion of the curve is determined by the value of σ W0
