
Fig. 3.
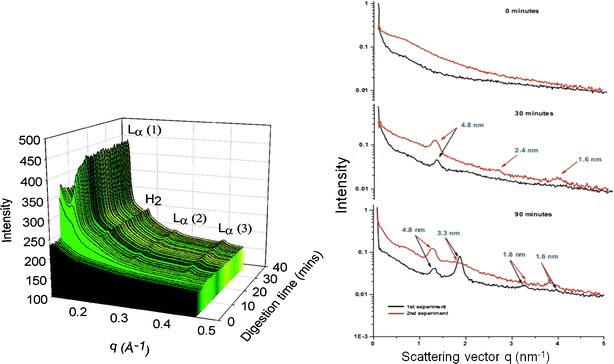
SAXS data using either synchrotron (left) or bench-top SAXS (right). The intensity of the scattered electrons is plotted versus the scattering vector (q), for synchrotron also versus time. The spectra illustrate the evolution of lamellar (L α) and hexagonal (H 2) phases during in vitro lipolysis. The arrows on the right panel denote the Bragg spacing for the lamellar phases at day = 1.6, 2.4, and 4.8 nm and at day = 3.3 nm for the hexagonal phase. At time points 0 min, no liquid crystals are visible, after 30 min a lamellar phase exists, and 90 min hexagonal and lamellar phases co-exist. Reprinted with permission from references (82,89)