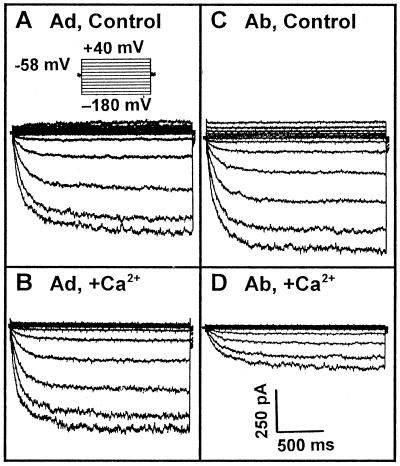
Figure 3.
Whole-cell recordings of broad bean adaxial (Ad; A and B) and abaxial (Ab; C and D) guard cell protoplasts with (B and D) or without (A and C) 1.5 μm Ca2+ (the calculated free Ca2+ concentration) in the pipette solutions. Voltage protocols are shown as in A, and the current and time scale bars are shown in D for all recordings.

